01The vision
When cloud, data warehouse, and AI token bills spiral simultaneously, clarity is not a luxury: it is survival.
Taming extreme enterprise complexity across three domains
Founders Ayan and Ishwar set out to solve the three places modern engineering teams overspend: cloud infrastructure (AWS services, accounts, commitments), data platforms (warehouses, clusters, storage across Snowflake, Databricks, Redshift), and AI engineering (LLM tokens, models, providers, agents, GPU clusters, and AI seat licences).
The central product challenge was preventing Quper from feeling like three disjointed tools duct-taped together. Our mandate was to tame this domain complexity into one unified operating system with zero handoff gap between design and production code: built on real data models where totals always equal the sum of their parts.
- 01
FinOps: Cloud Spend
Monitors services, accounts, budgets, and commitments. Operators uncover anomalies, right-size instances, eliminate idle waste, manage compute commitments, and track realised savings.
- 02
DataOps: Data Platforms
Tracks warehouses, clusters, queries, and storage across Snowflake, Databricks, and Redshift using each platform's native vocabulary: credits, DBUs, and RPU-hours.
- 03
AIOps: LLM & AI Spend
Observes tokens, models, providers, agent chains, RAG queries, GPU infrastructure, and AI seat licences: routing traffic to cheaper models, caching prompts, and attributing costs to teams.
02The website
A technical marketing surface engineered to turn skeptical engineering leaders into committed platform champions.

Authoritative narrative from positioning to production
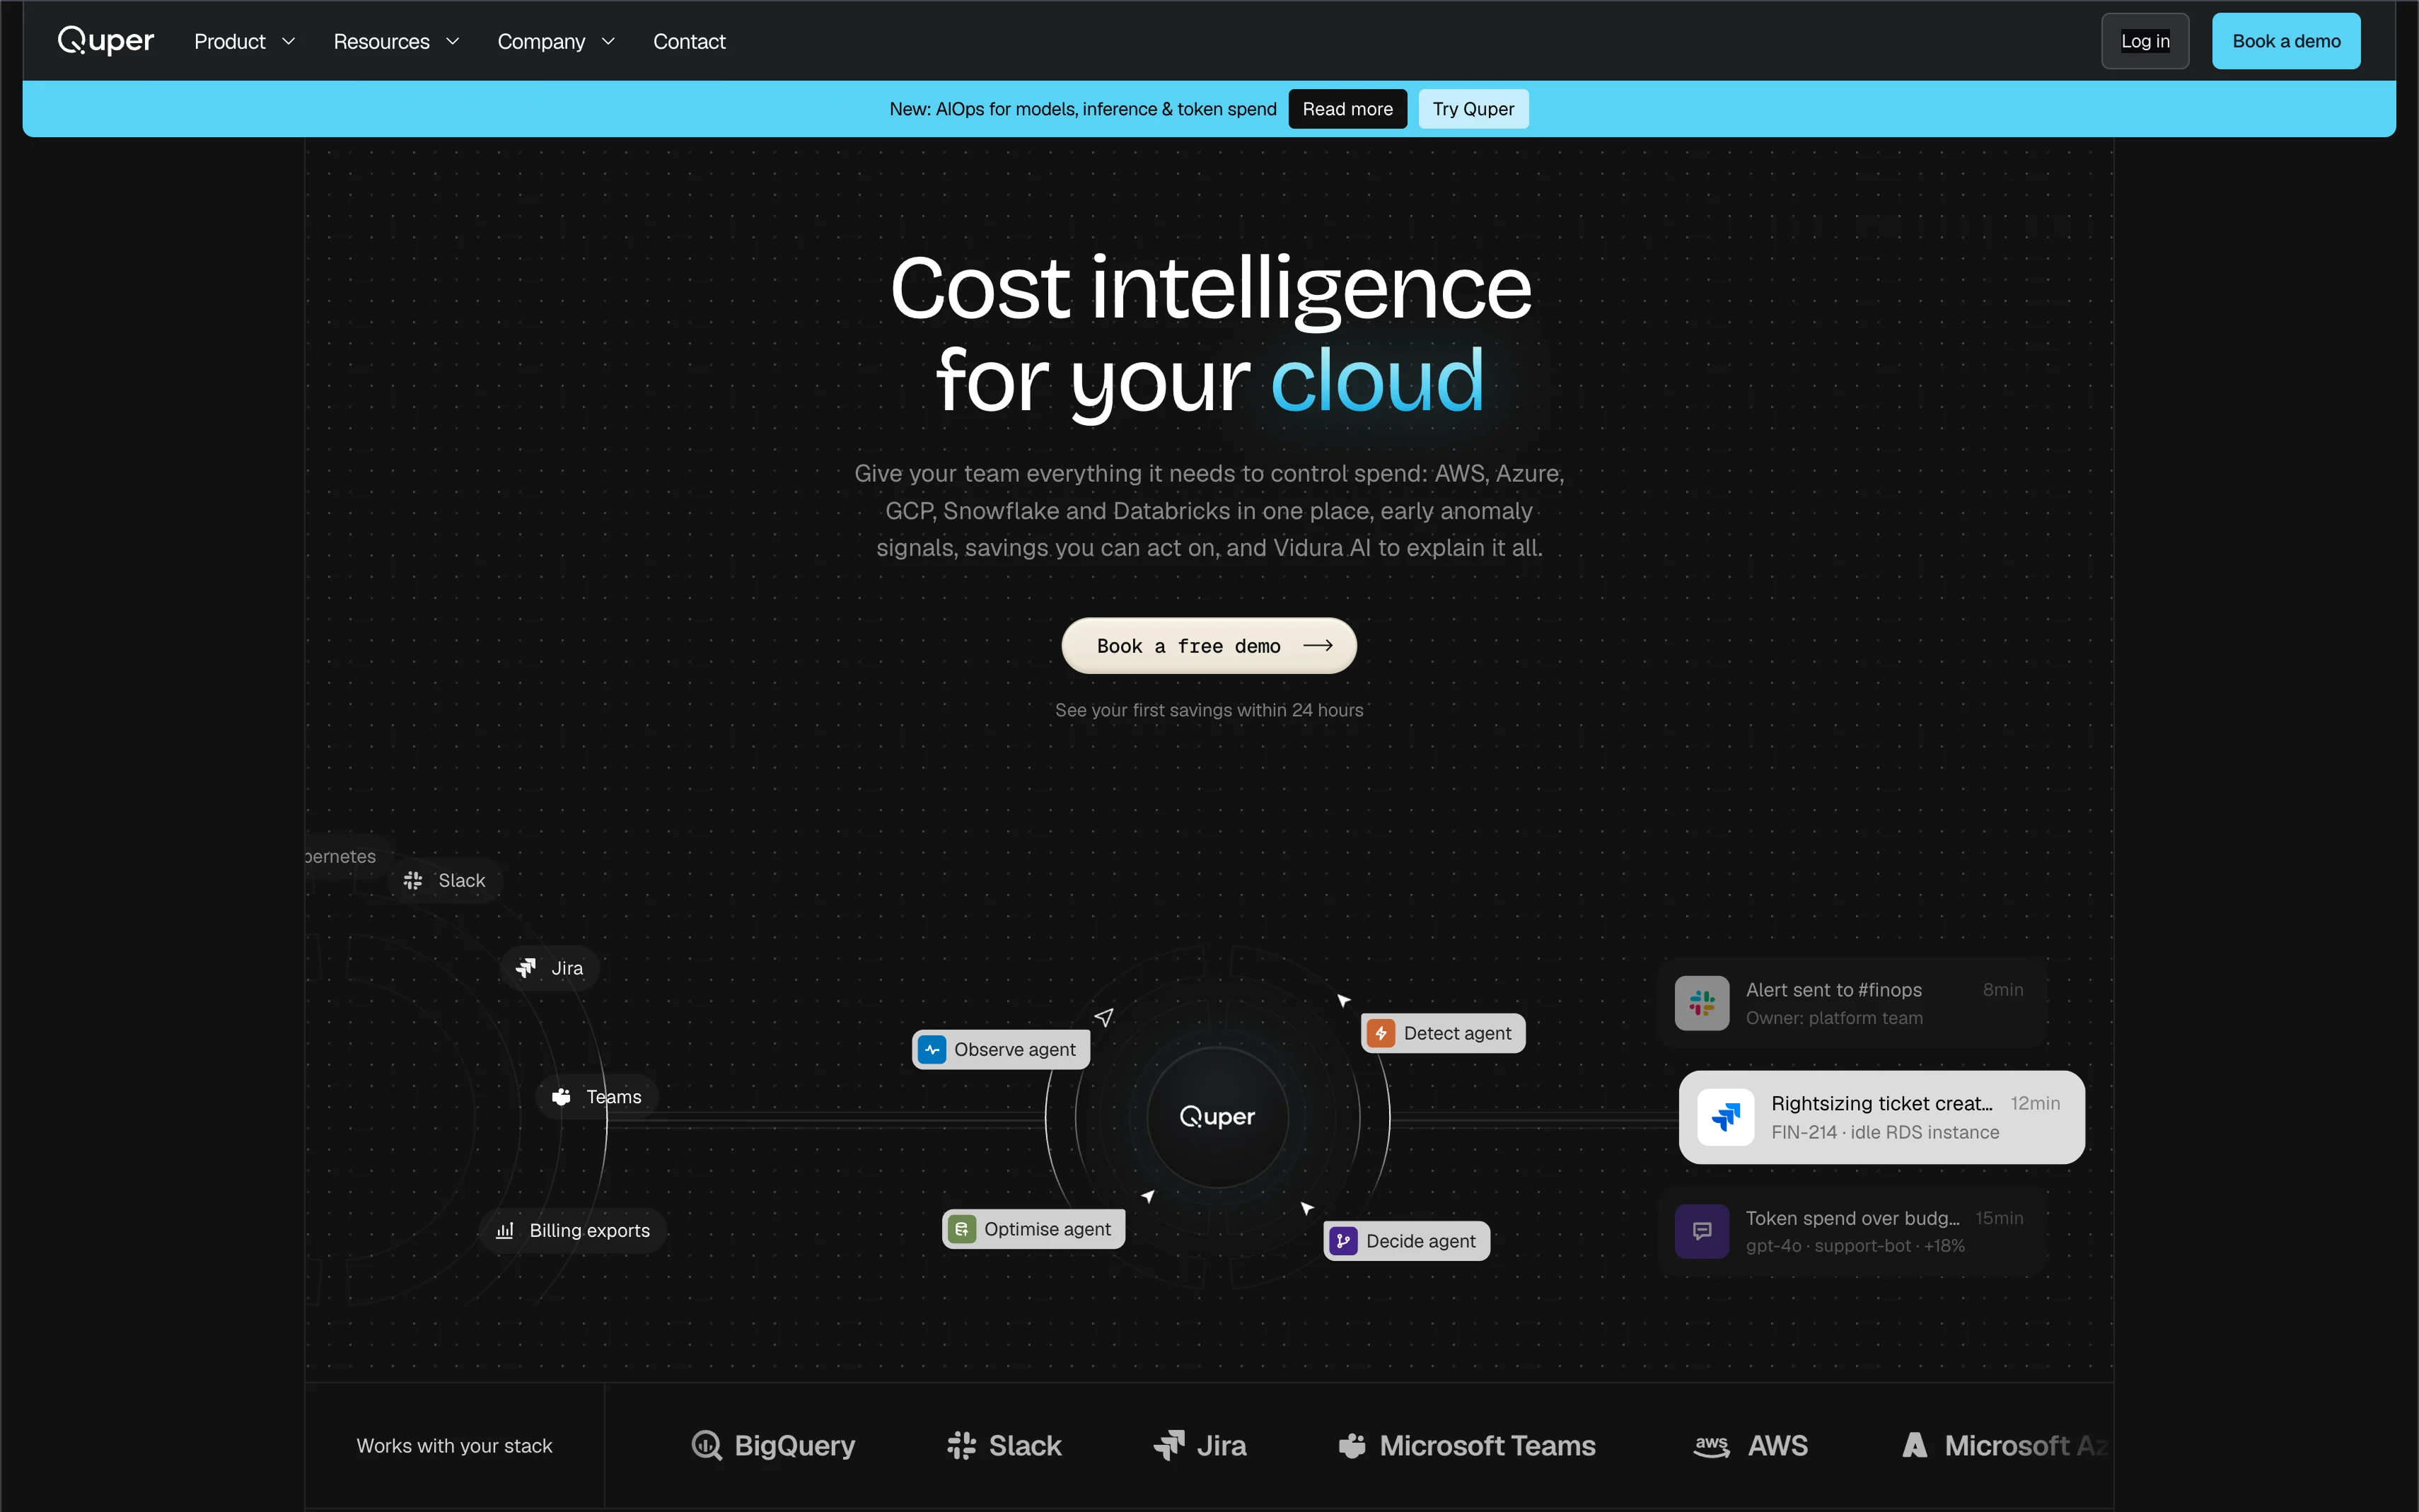
Before enterprise buyers sign high-value annual contracts, the marketing surface must command immediate technical respect. We designed and engineered the complete Quper marketing website to communicate multi-cloud capability with crisp, high-converting clarity.
The website distills massive telemetry capabilities into intuitive visual models: walking buyers from macro spend trends down to granular SQL statement cost profiles and automated model routing. Debuting at the Singapore Tech Conference, the design garnered immediate recognition from global investors and enterprise buyers, accelerating Quper's entry into Startup Foundry.
03Design system
Designing over 500+ screens across a multi-tenant platform demands strict color discipline and an uncompromising component architecture.
Quper Design System: The Four-Phase Operating Loop
Four-Phase Loop#38BDF8#FBBF24#C084FC#34D399#0A0B0E#14161COne operating loop: Observe, Detect, Decide, Optimise
The core breakthrough in Quper's product design is the four-phase operating loop. Every pillar follows the exact same progression, and color strictly encodes the phase, not the pillar: 1. Observe (Spend & Usage, Allocation, Workloads, Telemetry Explorer, People & Seats), 2. Detect (Signals and anomalies), 3. Decide (Cost Impact, Allocation Impact, Budgets), and 4. Optimise (Rightsizing, Waste, Commitments, Storage, Savings, Model Routing, Caching).
Because all three pillars share this identical loop, someone who learns FinOps already knows how to navigate AIOps. The product feels like one continuous system rather than three separate products.

Design principles visible in the work
Color discipline: no arbitrary hues per screen. The interface relies on obsidian neutral surfaces accented exclusively by the four phase tokens. This creates an immediate cognitive map for operators scanning hundreds of metrics.
Closed by default: table rows, dropdowns, detail sheets, and organizational tree branches start collapsed and reveal depth only on user action. This keeps dense financial and infrastructure data calm, legible, and focused.
Consistency across pillars: every screen shares identical date controls, table pagination, and a unified 'Filters' chip. Power-user microinteractions, such as quick keyboard navigation, the global sidebar shortcut (⌘), sound effects, and an animated auth panel, bring tactile polish to enterprise software.
04The 3 products
FinOps, DataOps, and AIOps: three enterprise disciplines unified in one cohesive platform shell.
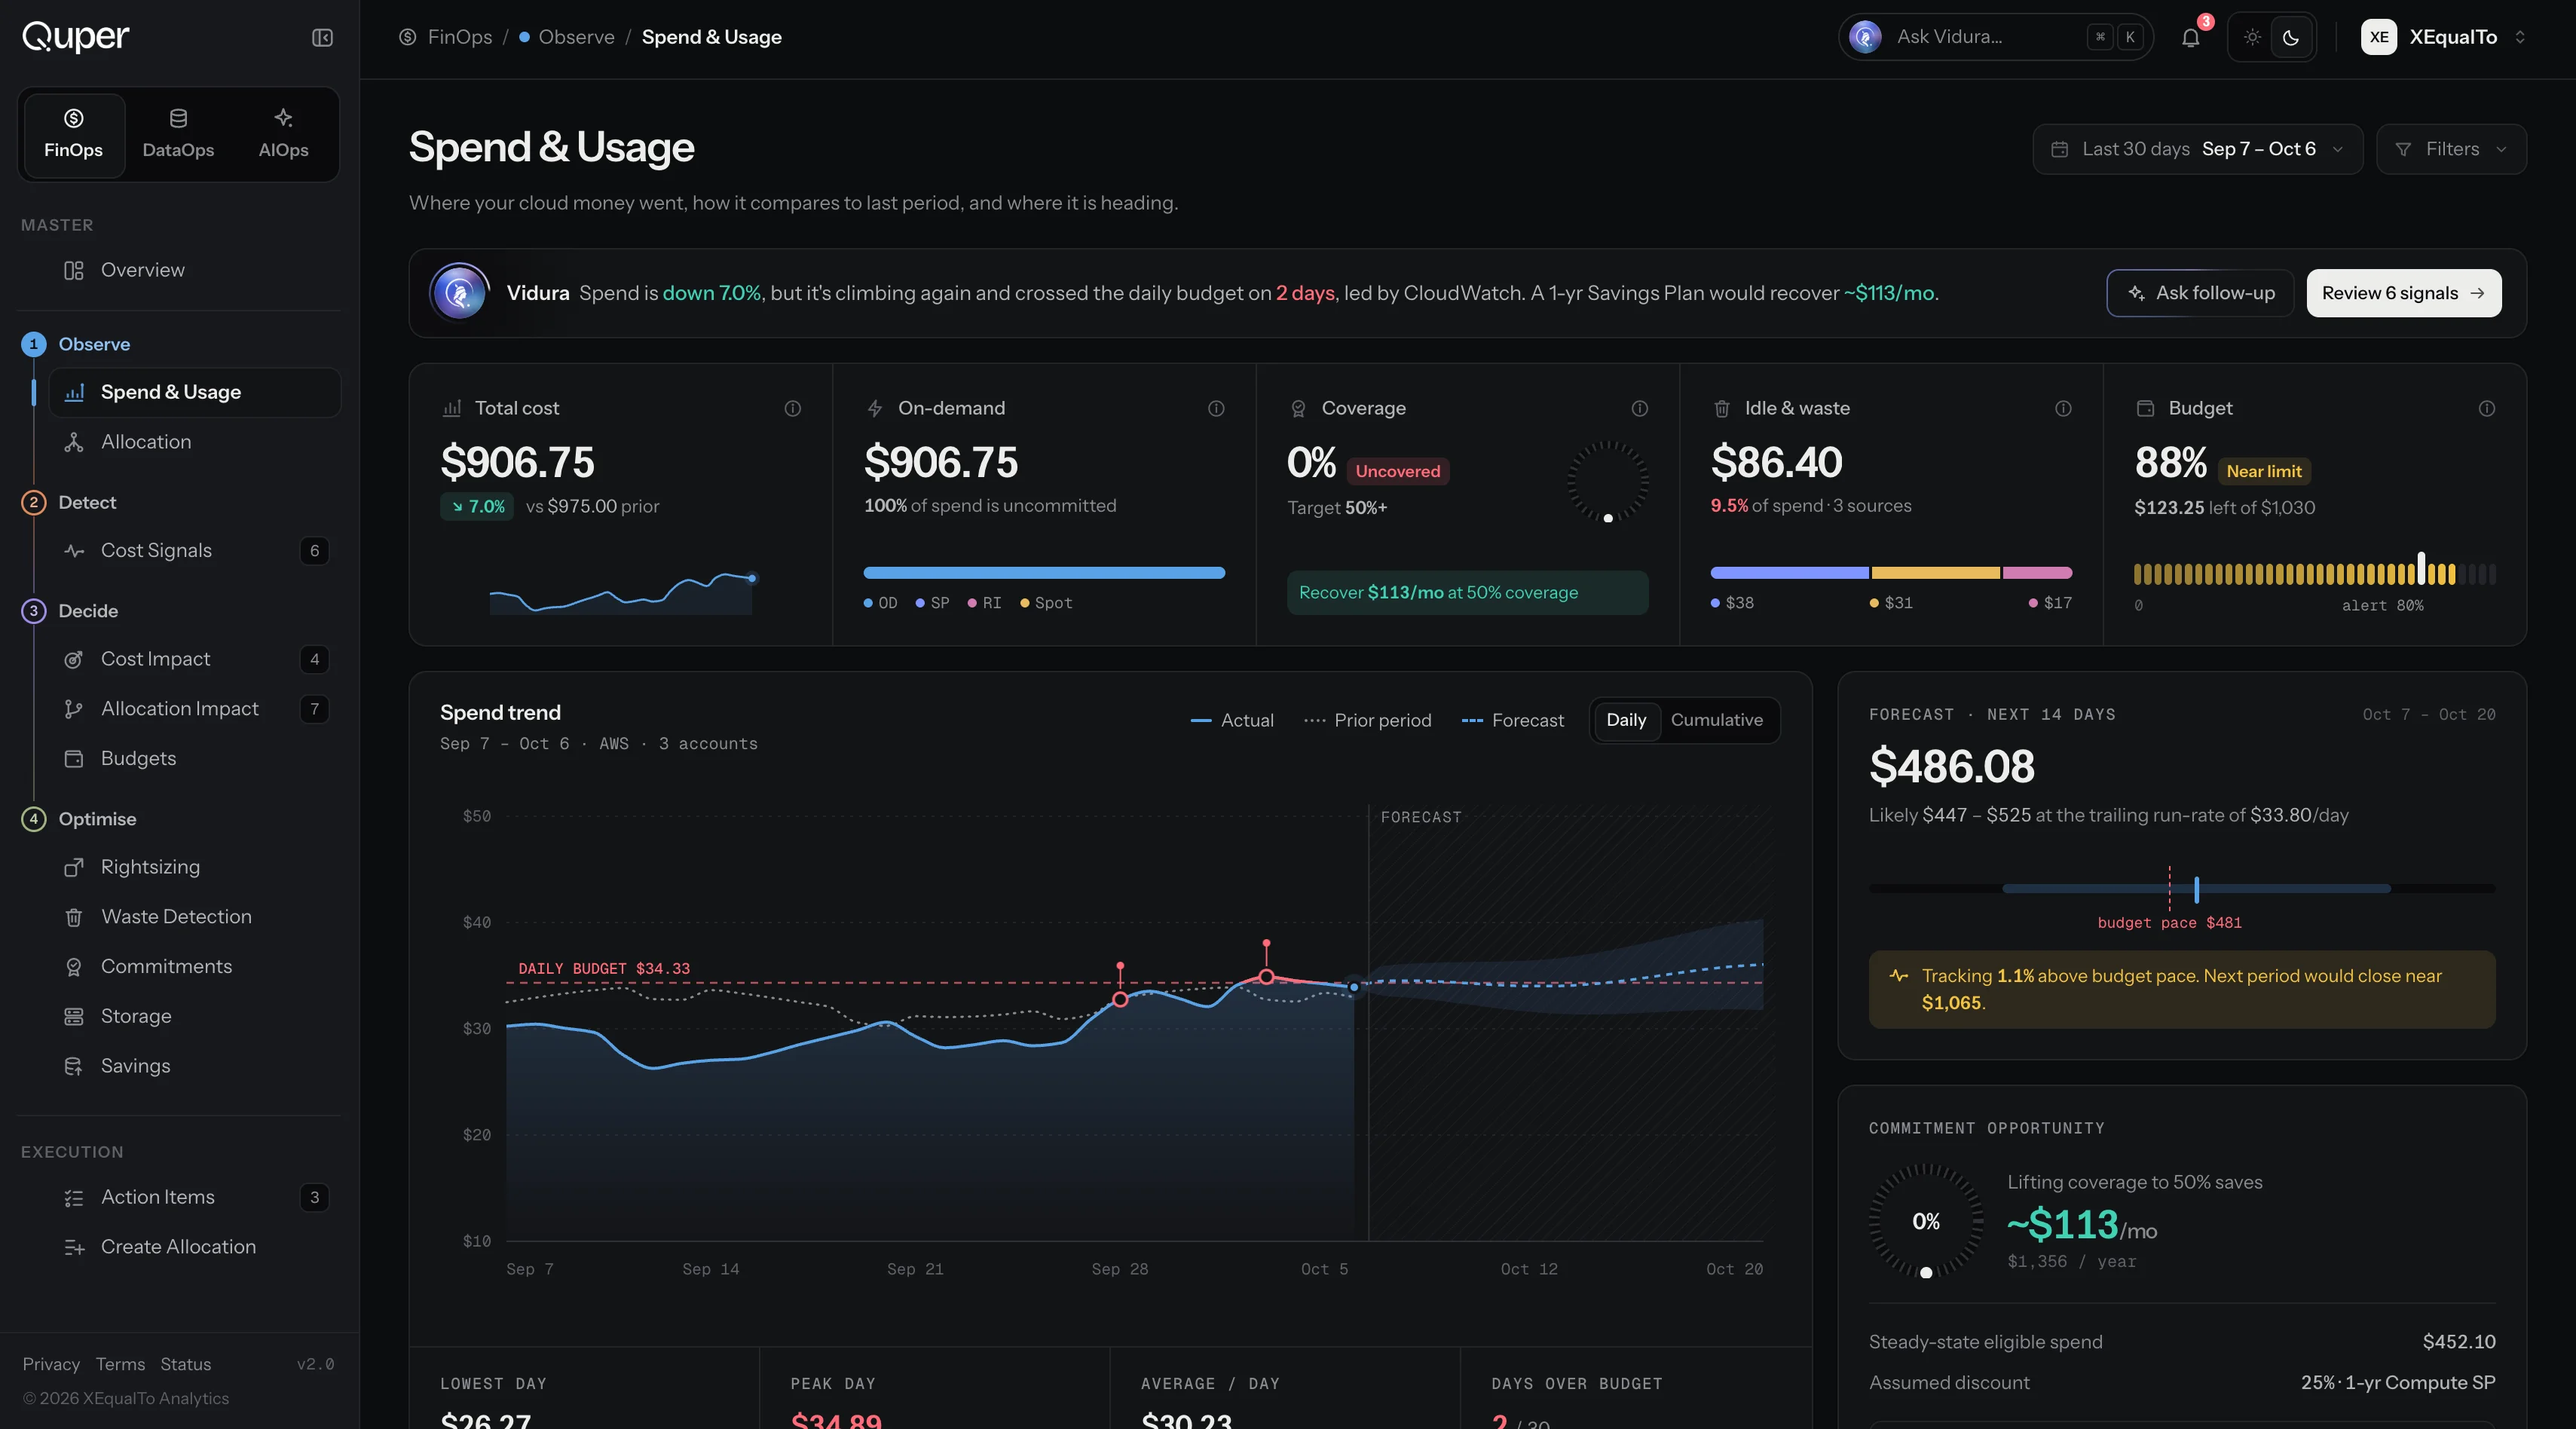
The platform shell: 50 routed screens across multi-tenant workspaces
Quper's shell handles enterprise scale seamlessly: a top-level pillar switcher, a platform-aware switcher for DataOps, a phase-grouped sidebar, breadcrumbs, notifications, and instant switching between dark and light themes. Behind the scenes, a multi-tenant workspace launcher and enterprise chooser allow operators to switch accounts with full role-based access controls.
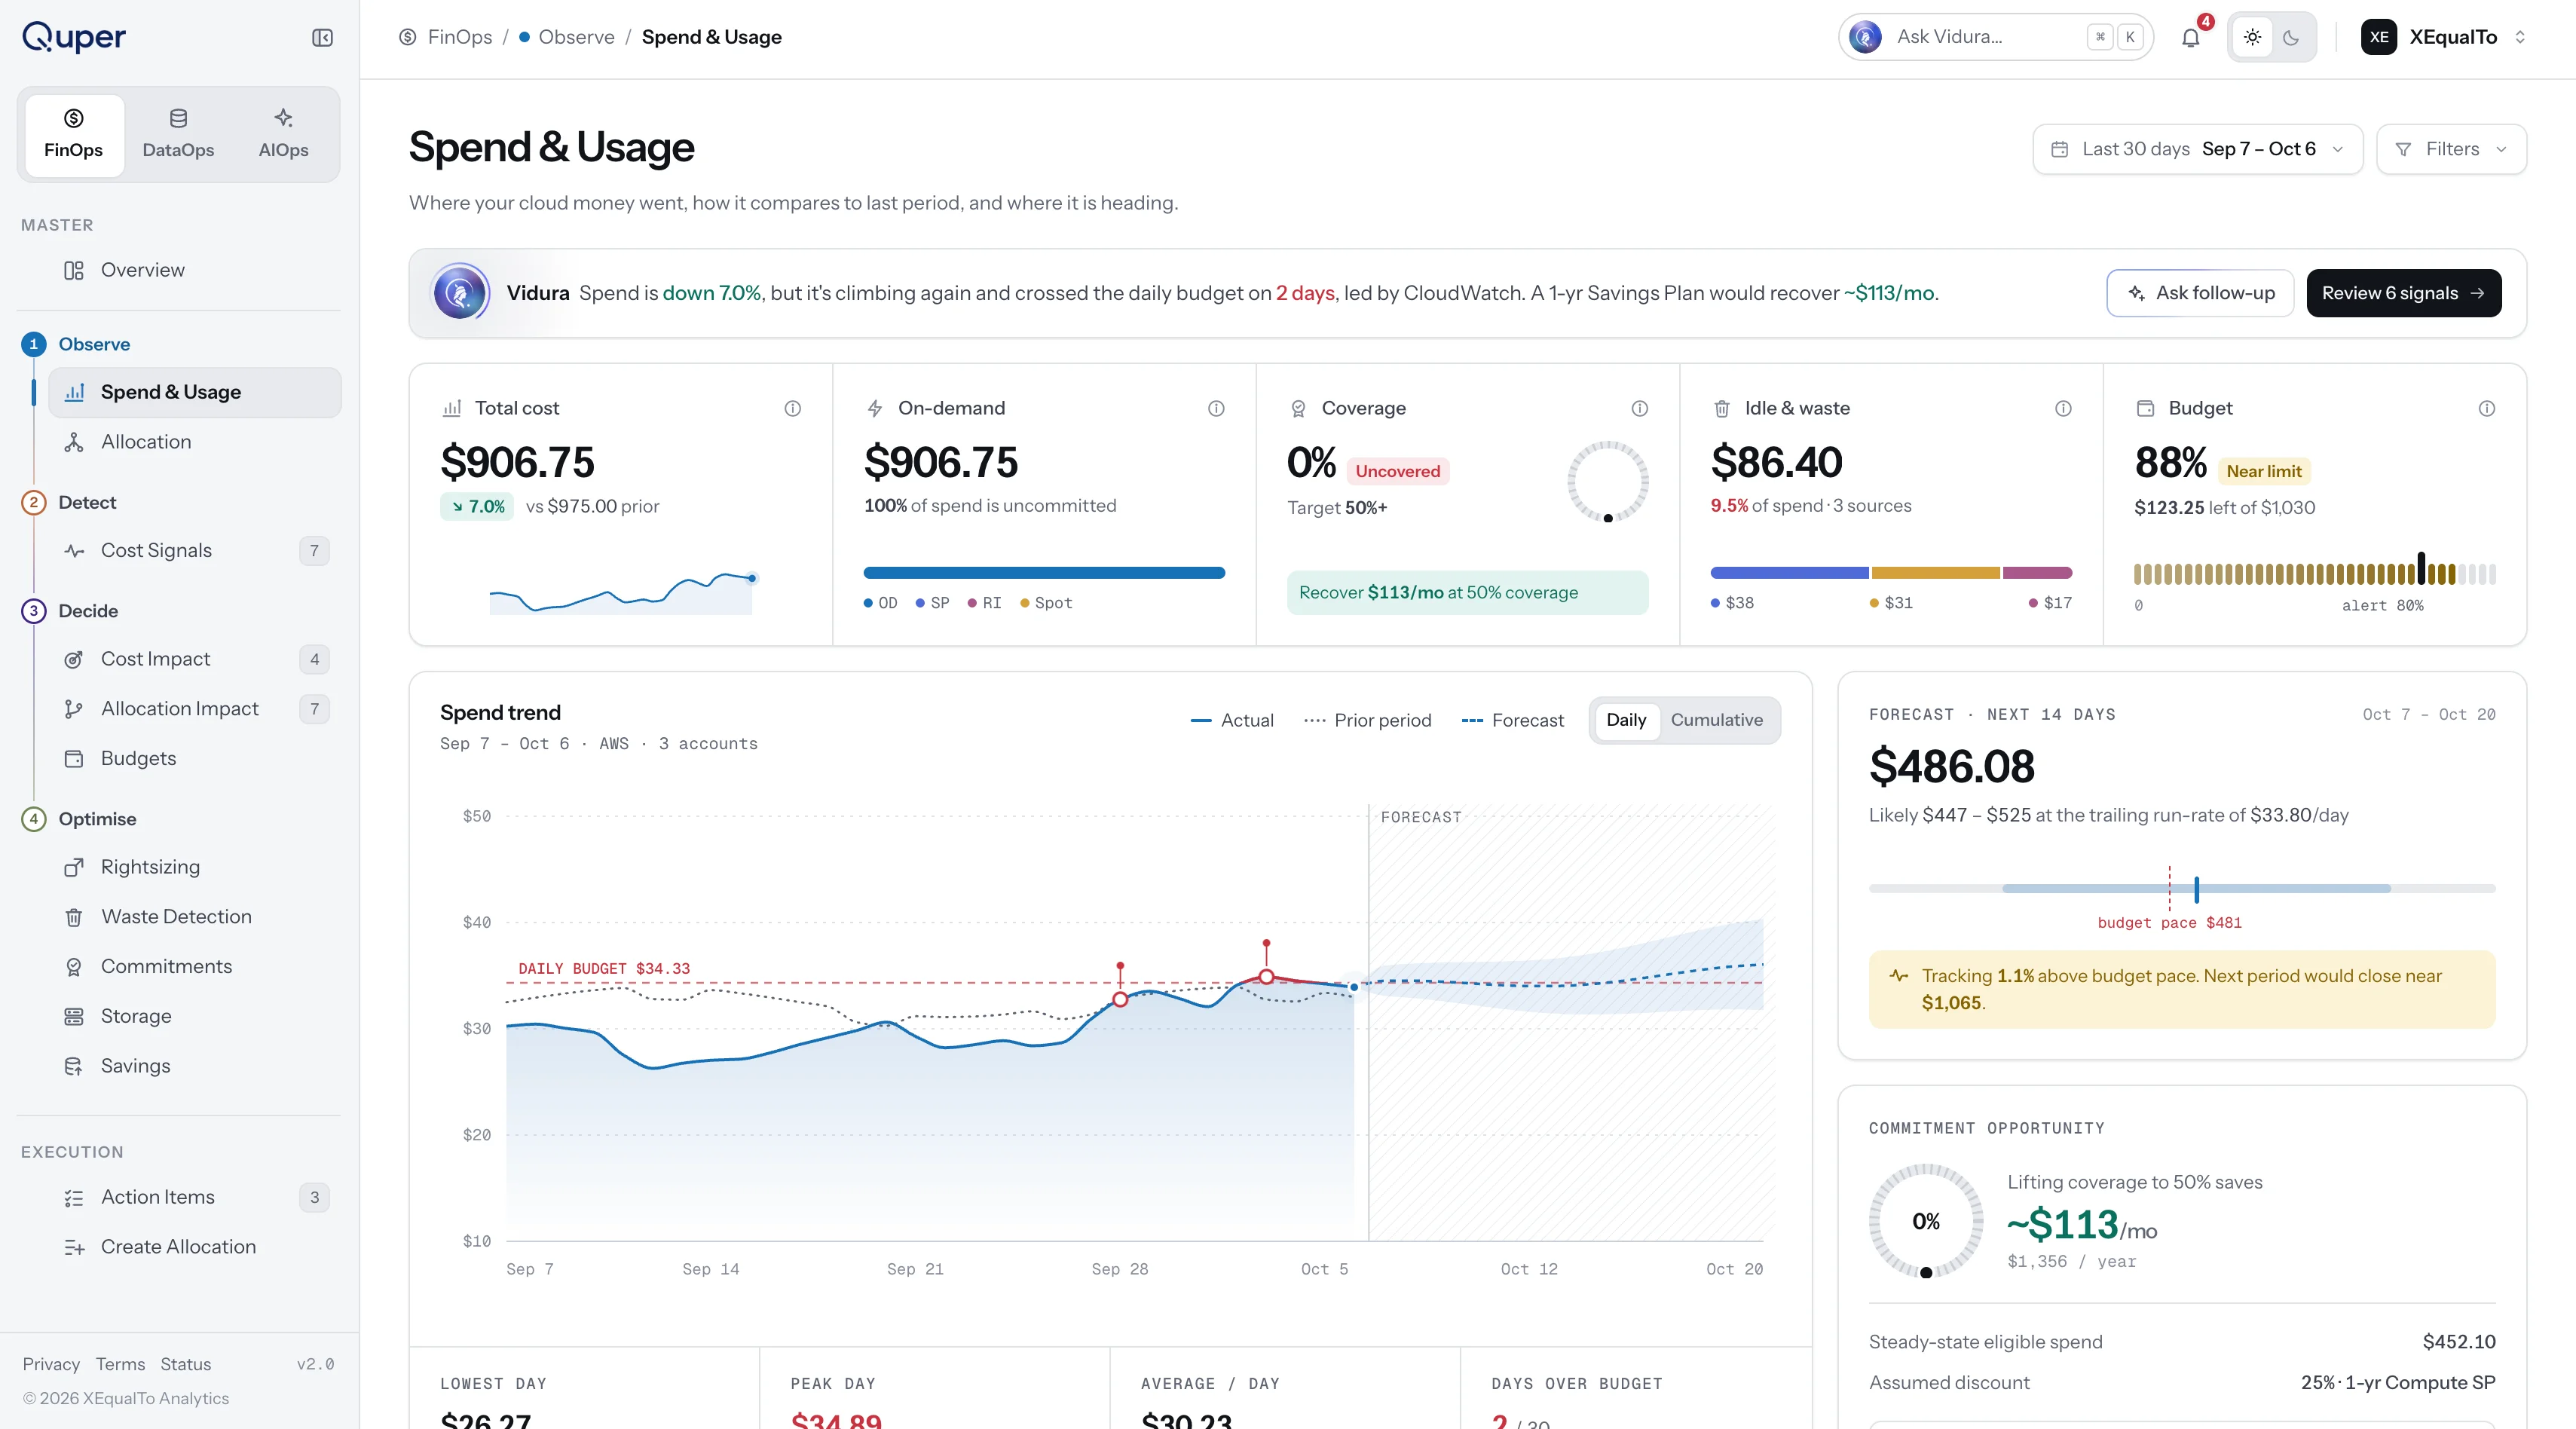
01: FinOps (The deepest pillar)
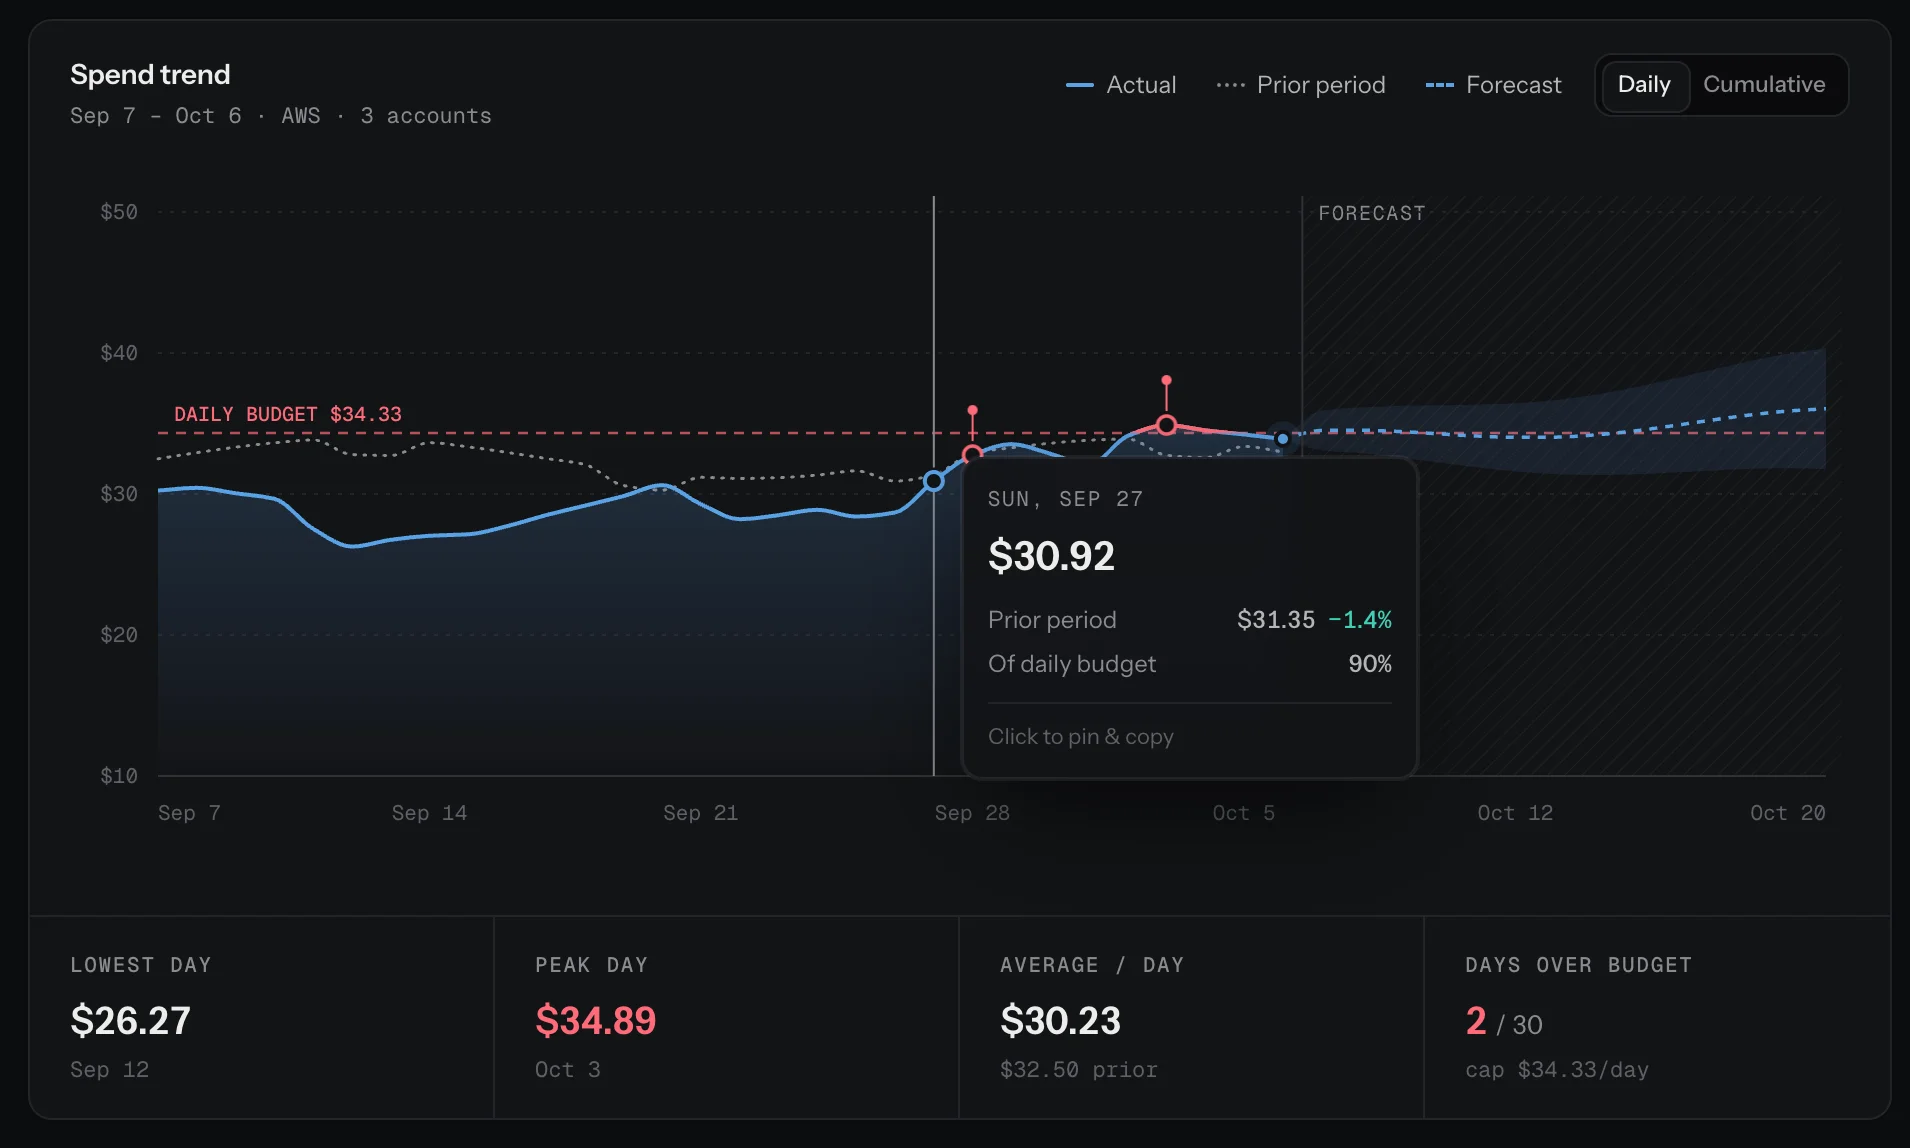
FinOps monitors cloud spend across AWS services, accounts, budgets, and compute commitments. The overview pairs trend forecasts with anomaly markers, while high-density services tables slide into granular detail sheets for immediate inspection.
We designed full allocation flows, cost and allocation impact matrices, and an organizational budget tree that rolls up from team to business unit to parent company. Dedicated workspaces for Rightsizing, Waste, Commitments, and Storage feed directly into a Savings ledger tracking realised versus estimated savings, connected to an Action Items kanban with assignees and Jira ticket sync.
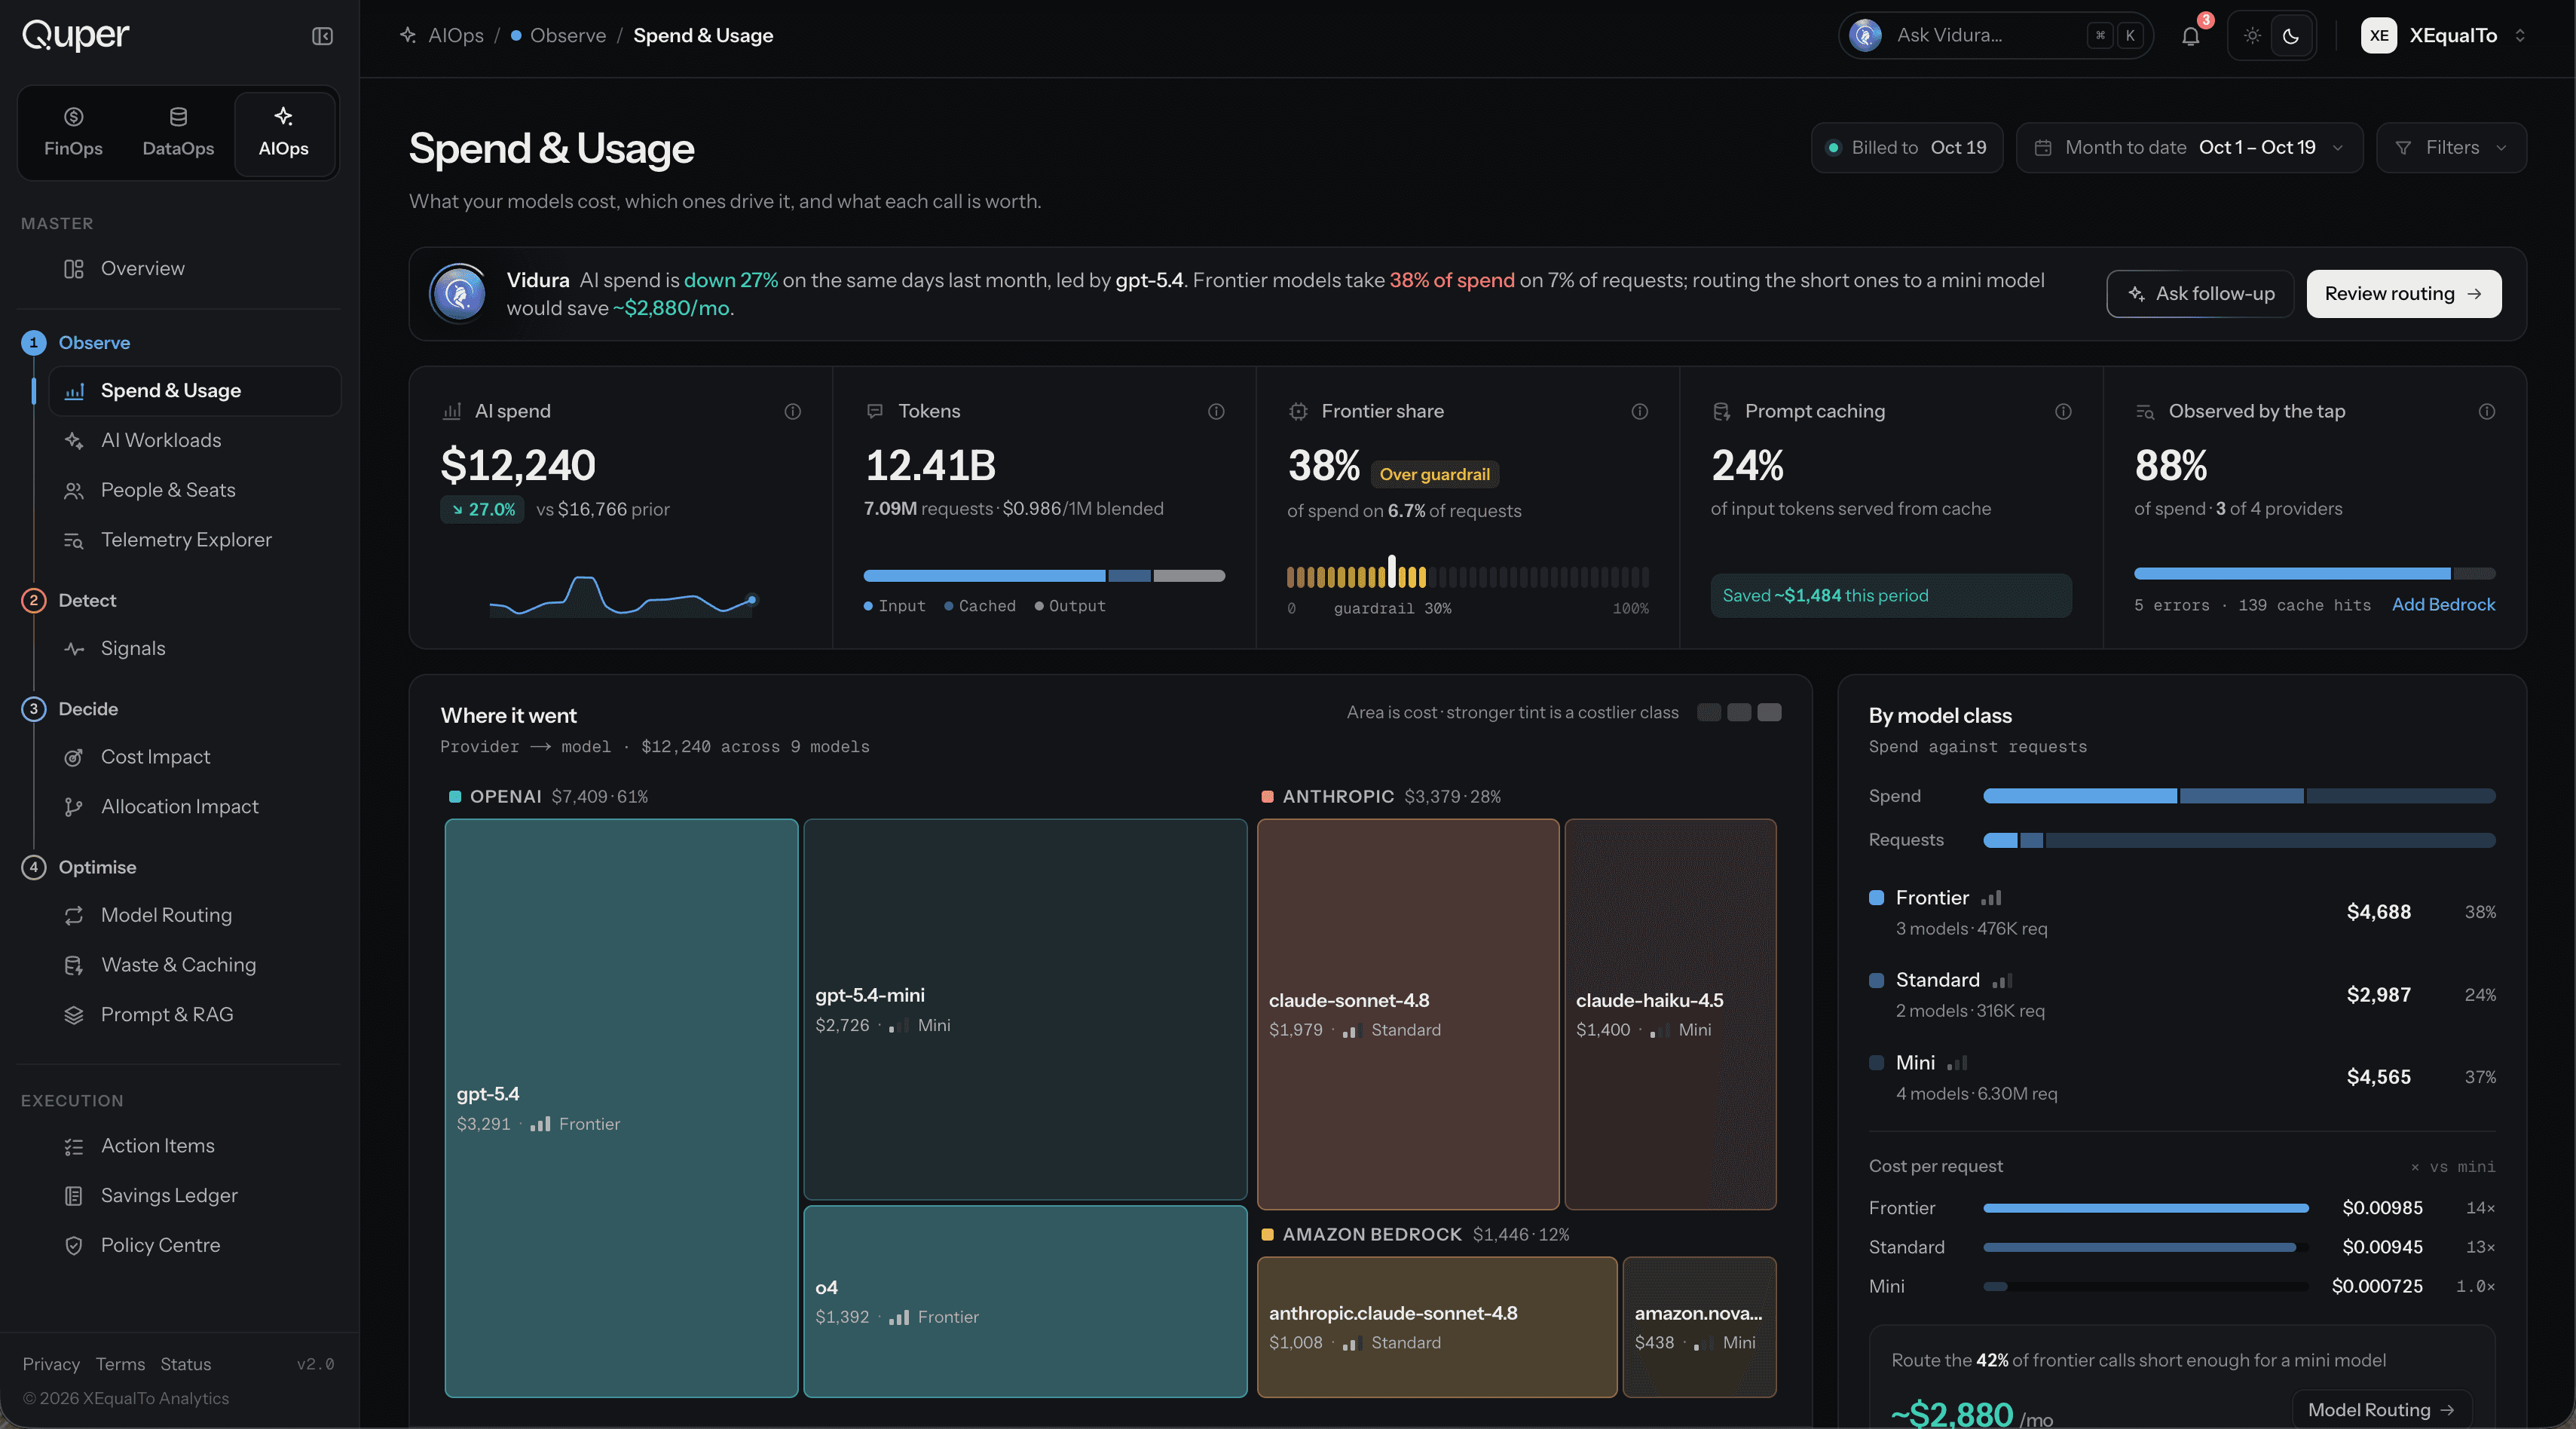
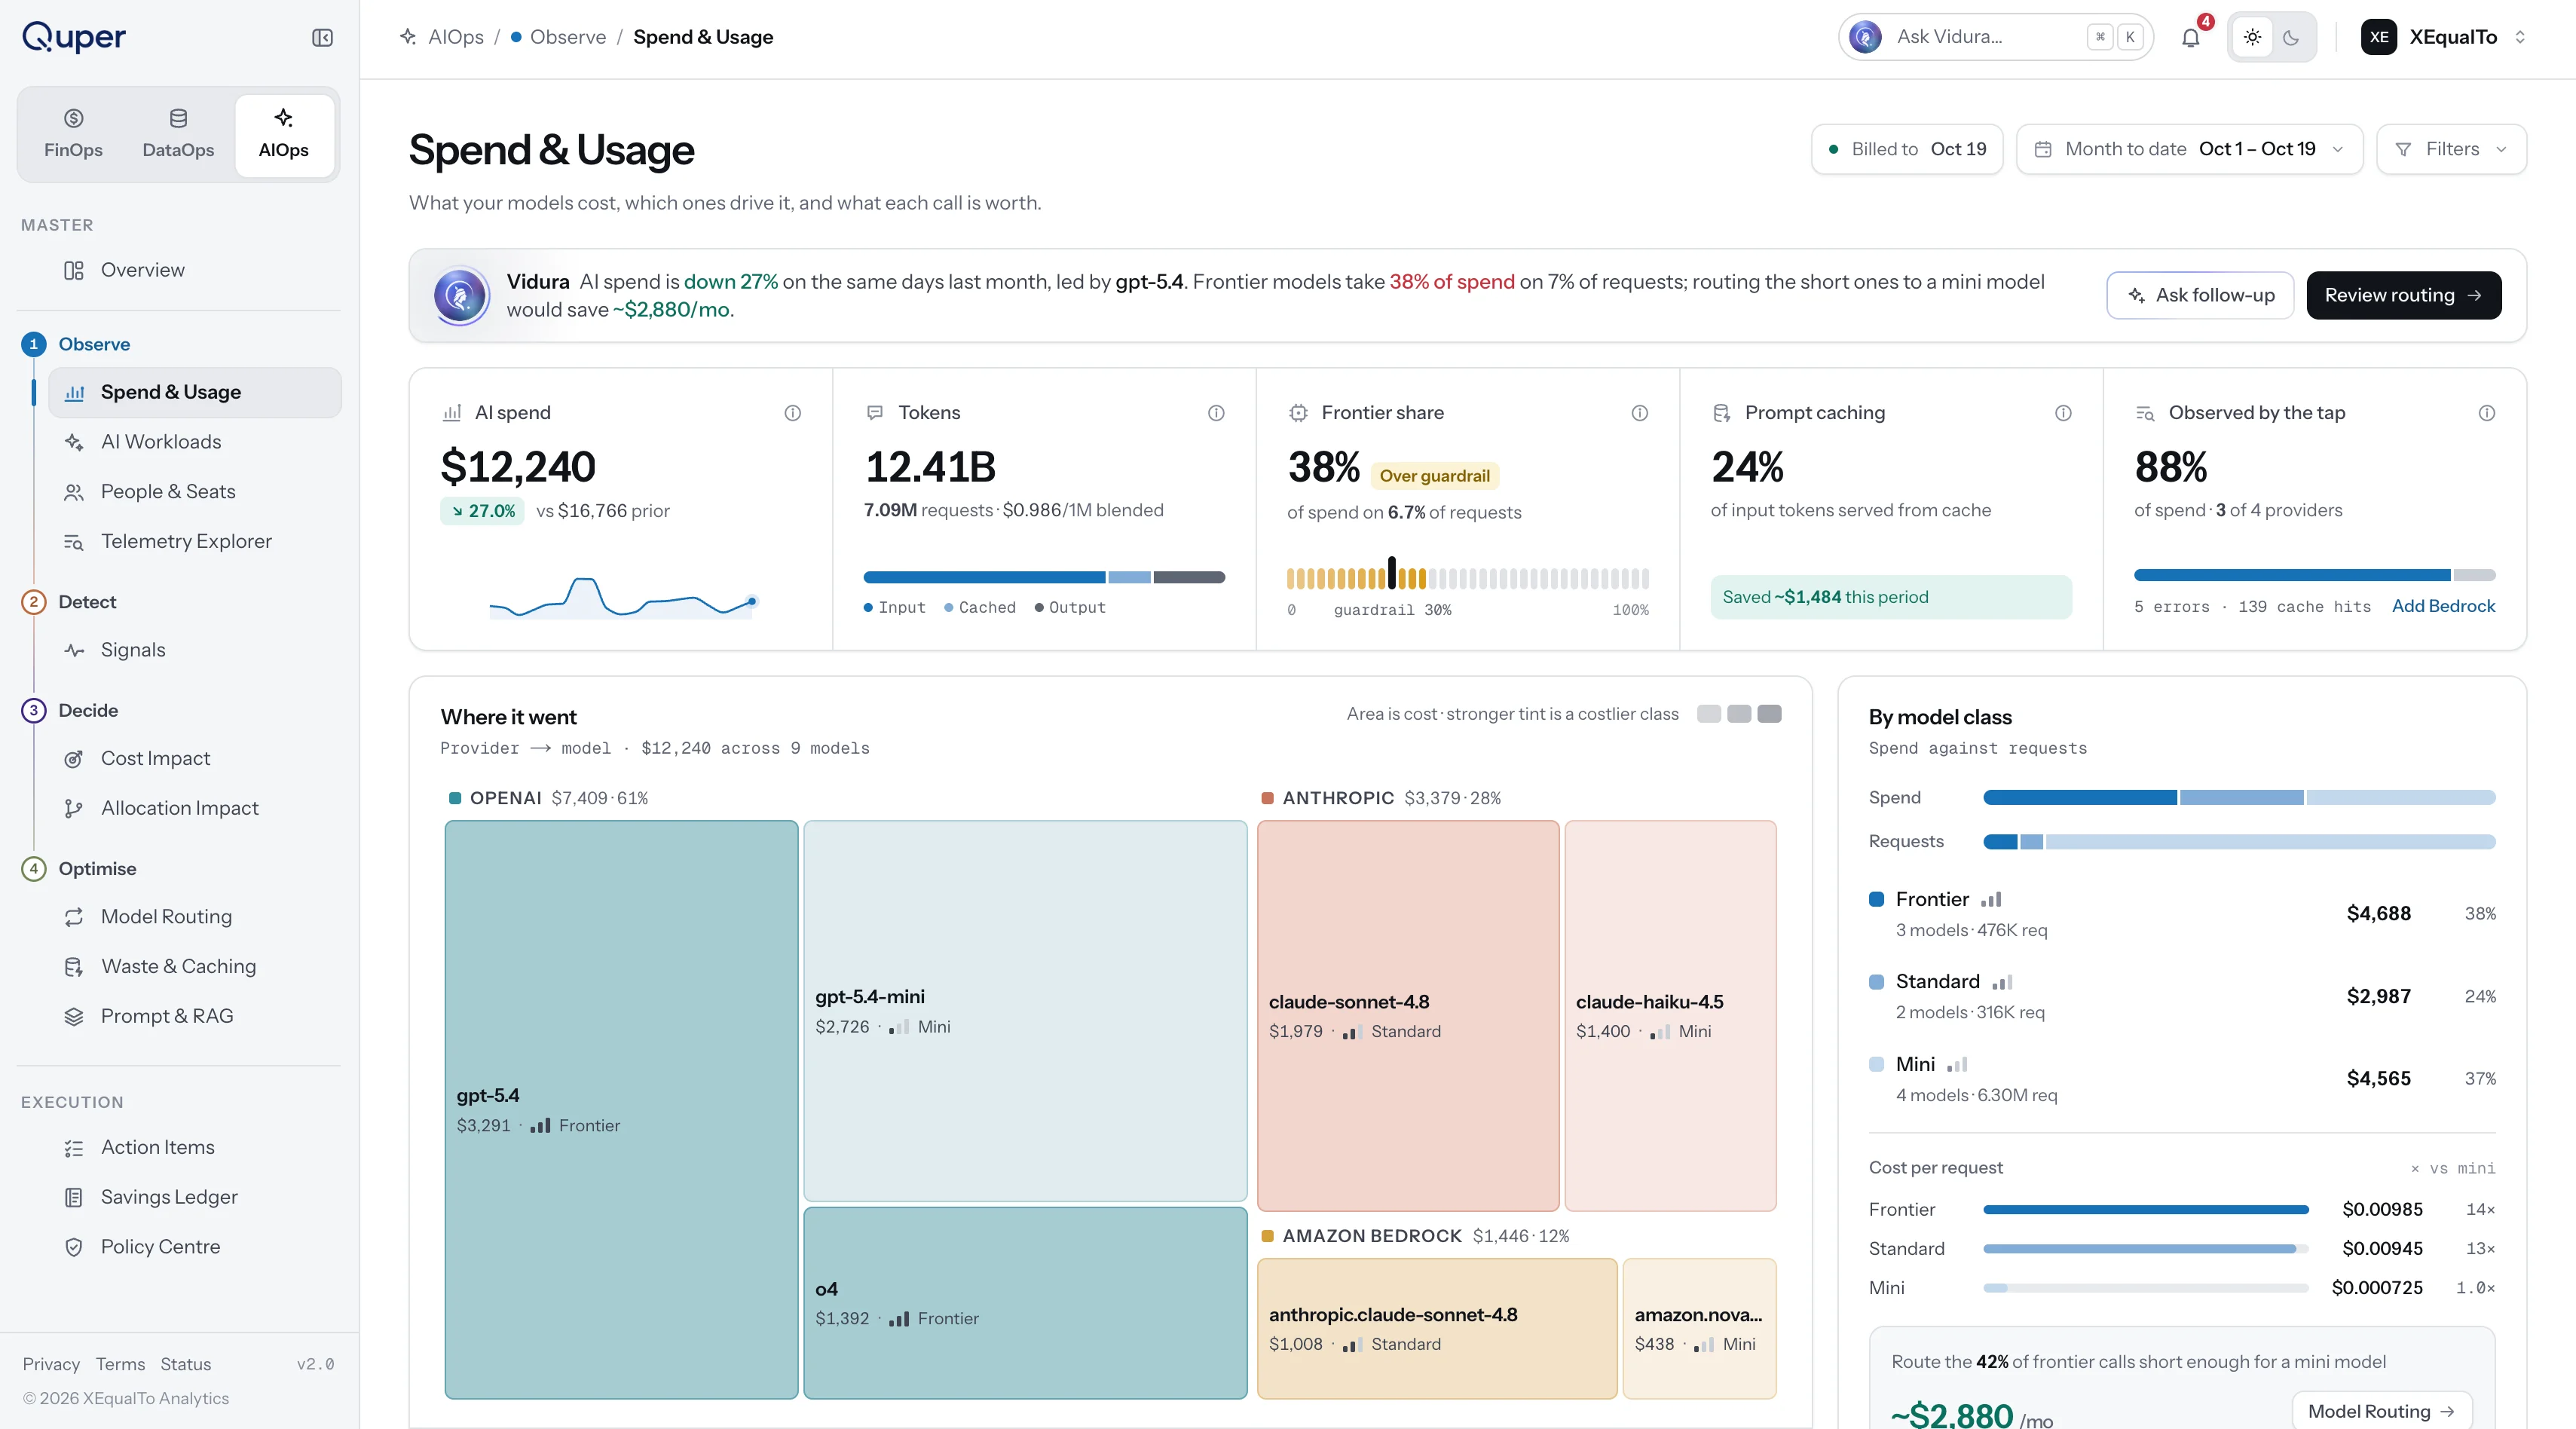
02: AIOps (LLM, model & infrastructure spend)
As engineering teams race to adopt generative AI, AIOps brings total transparency to token consumption, frontier models, and specialized infrastructure. The platform tracks monthly spend categorized by model, provider, and class, while AI Workloads maps GPU clusters, Kubernetes nodes, vector databases, and multi-agent chains.
The People & Seats view highlights idle licenses, frontier-model overuse, and redundant API calls. Teams inspect requests in the Telemetry Explorer, enforce governance via automated Policies (monitor, warn, or enforce), and deploy Model Routing and prompt caching to slash AI bills.
03: DataOps (Platform-native warehouse observability)
DataOps speaks the native language of modern data platforms. Rather than forcing generic metrics, navigation dynamically adapts to Snowflake (credits and warehouse clusters), Databricks (DBUs and jobs), and Redshift (RPU-hours and concurrency). Operators run the same Observe-Detect-Decide-Optimise loop across their entire analytical stack.
05Vidura AI
Vidura is an in-product AI assistant embedded directly into the top bar: answering questions grounded strictly in platform data.
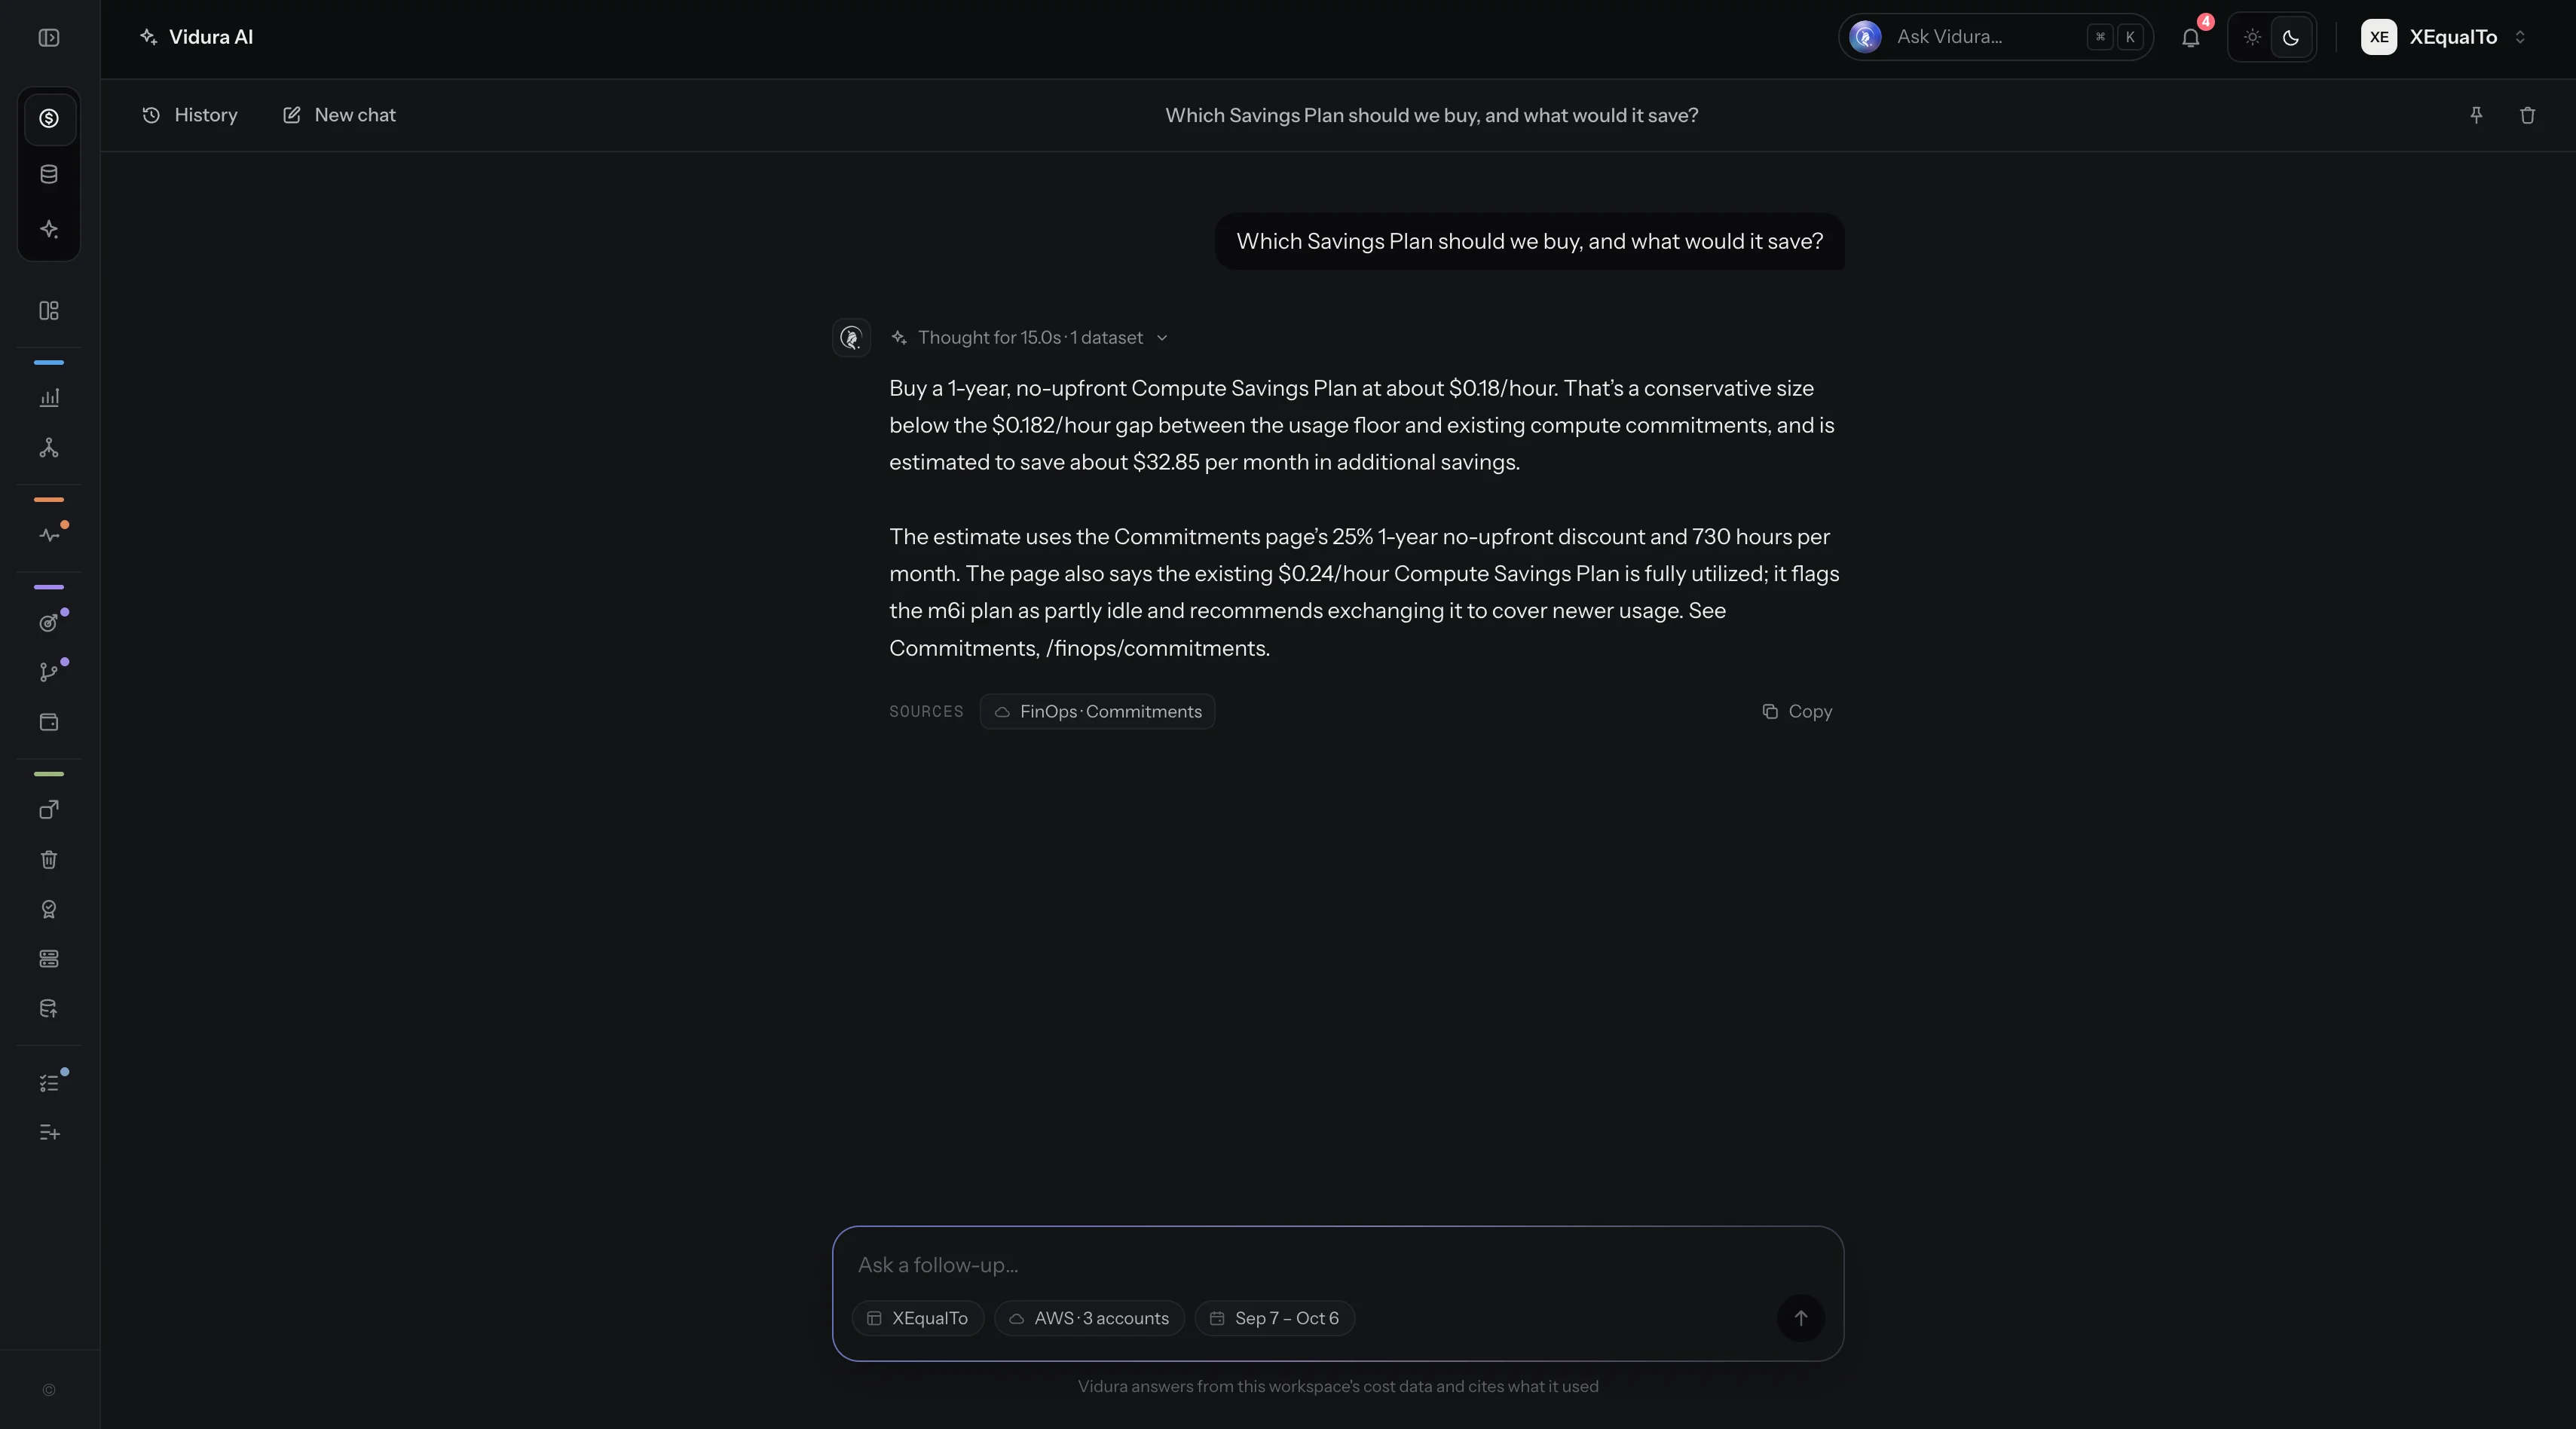
Grounded intelligence powered by tool calls, not hallucinations
In financial and infrastructure operations, an AI that hallucinates numbers is worse than useless: it is dangerous. Vidura was architected from day one as an AWS Lambda agent using explicit tool calls for querying, aggregating, and searching.
Every total, credit count, and dollar figure is strictly computed by tools and validated against an underlying data JSON layer, never guessed by the language model. A custom validation script guarantees that every figure in Vidura's response equals the sum of its parts, providing an auditable paper trail for finance and engineering leads alike.
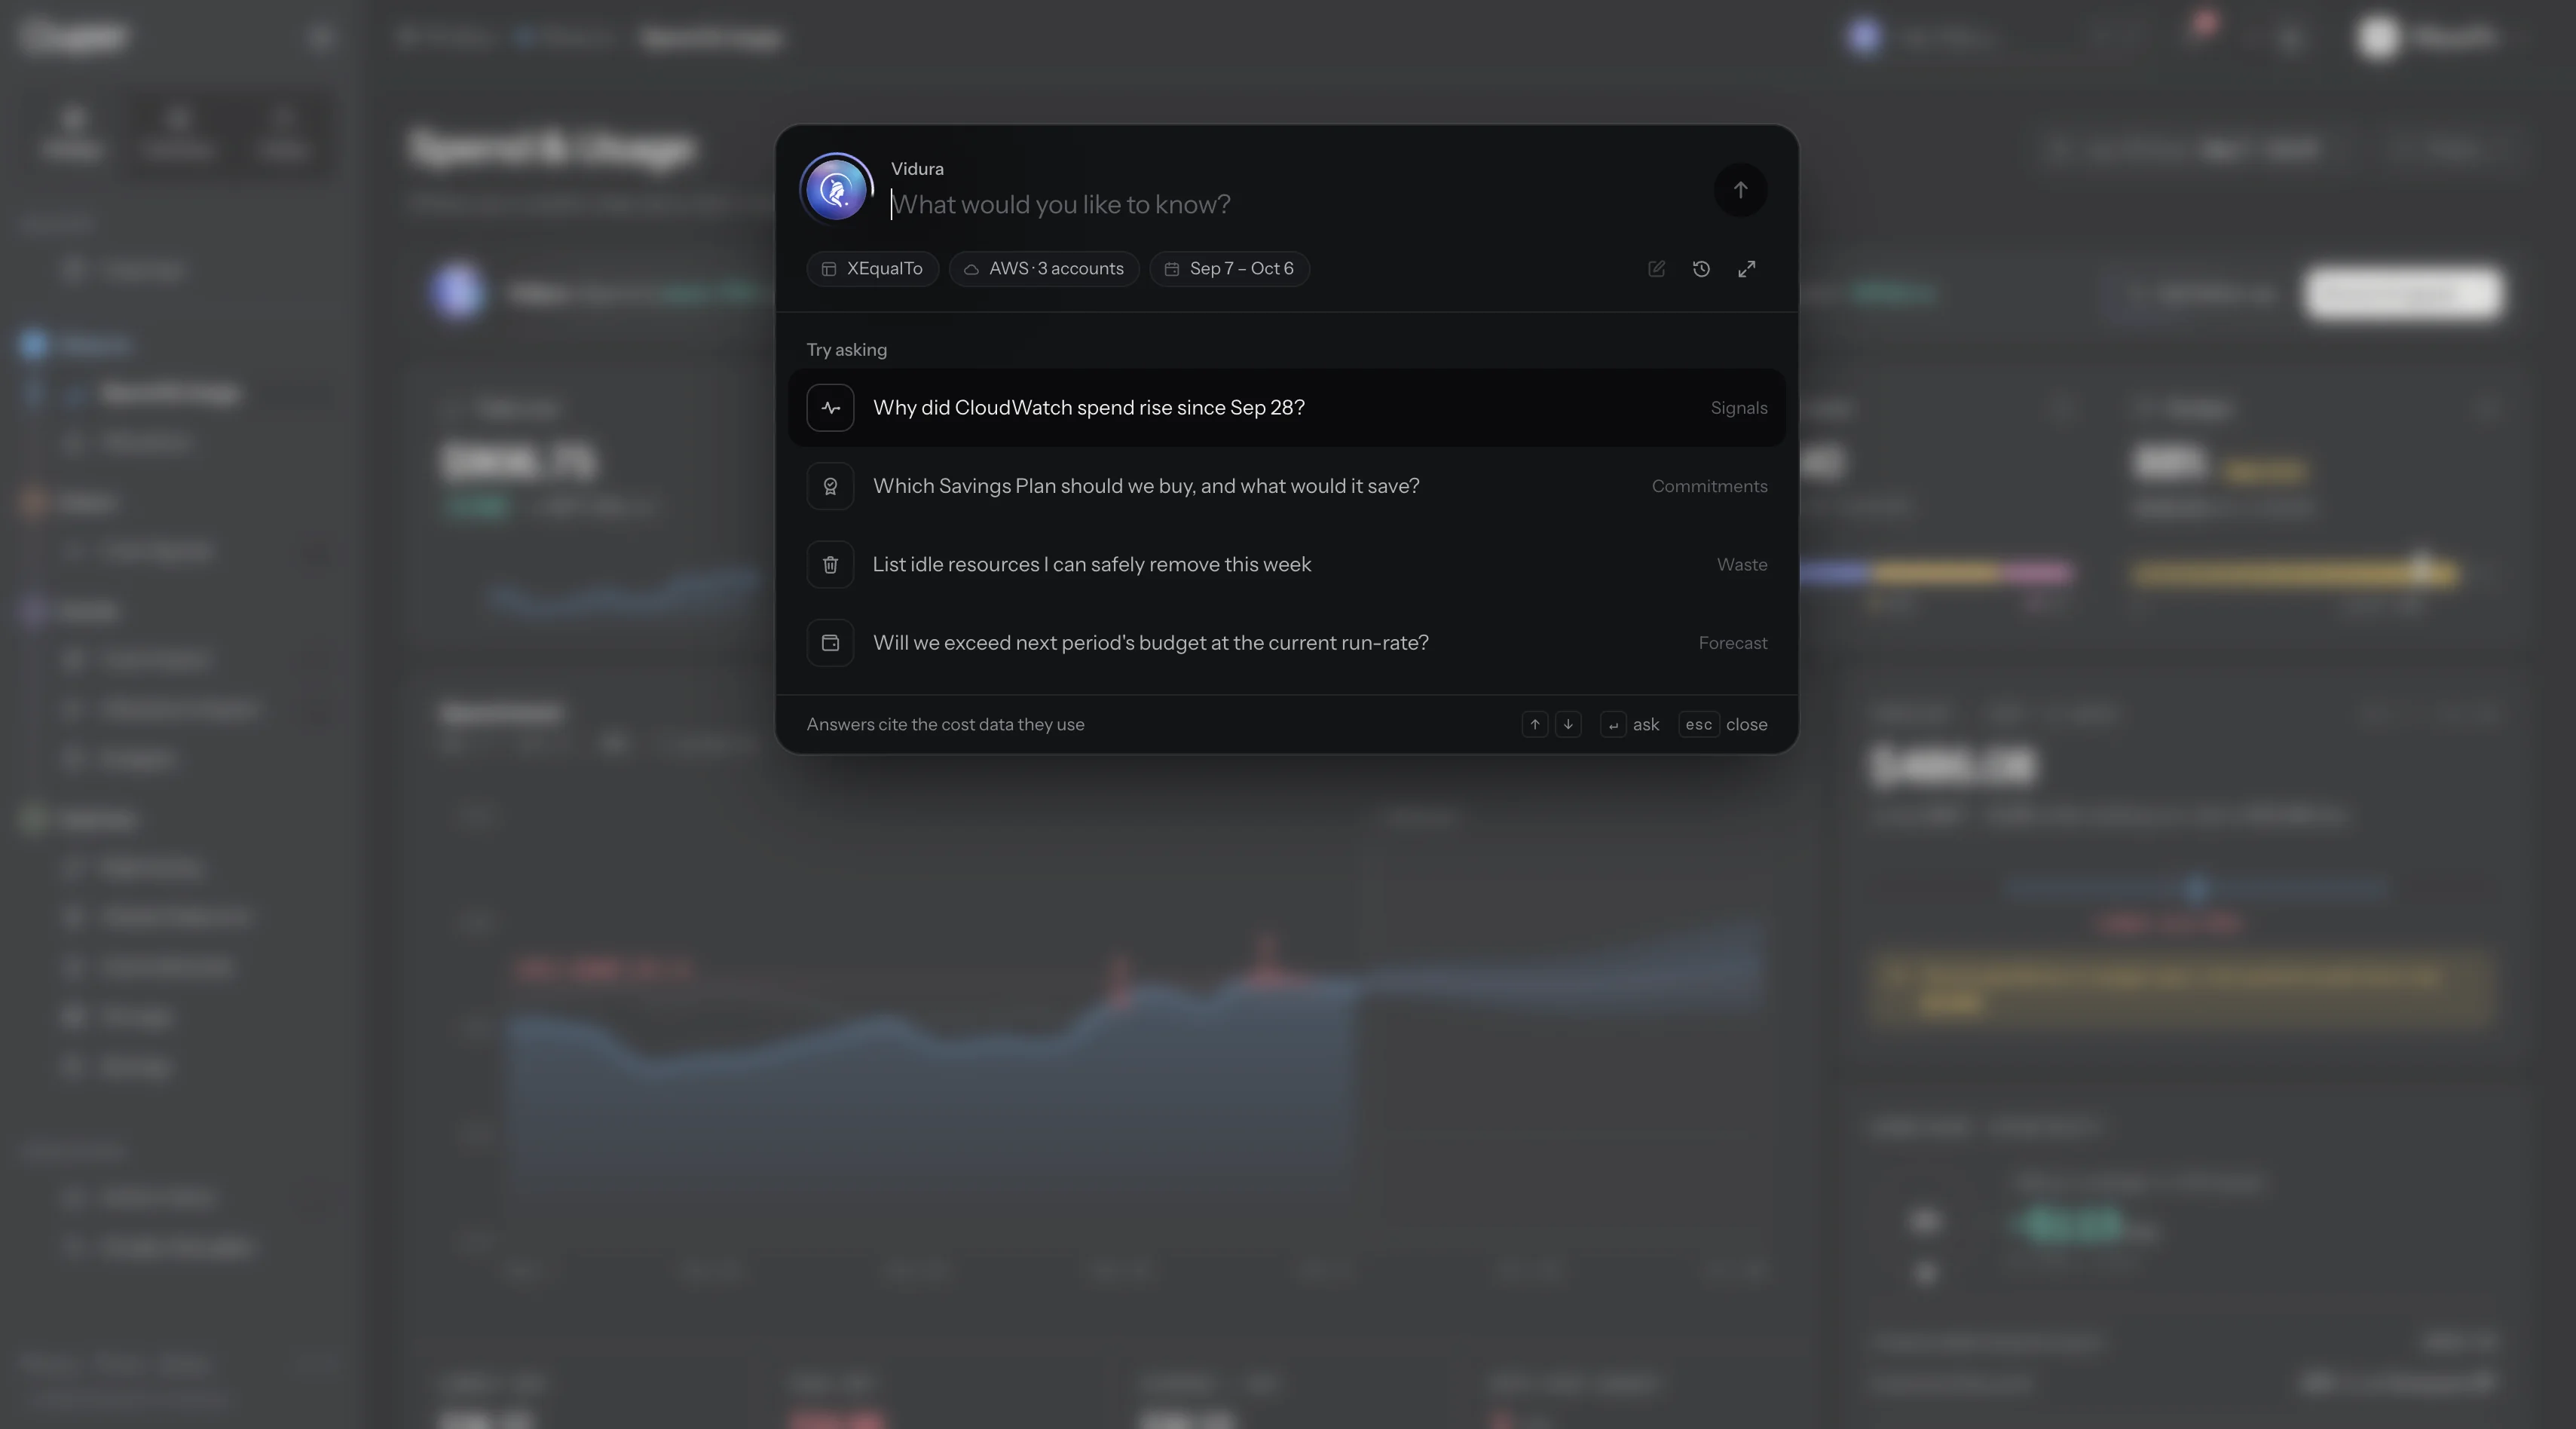
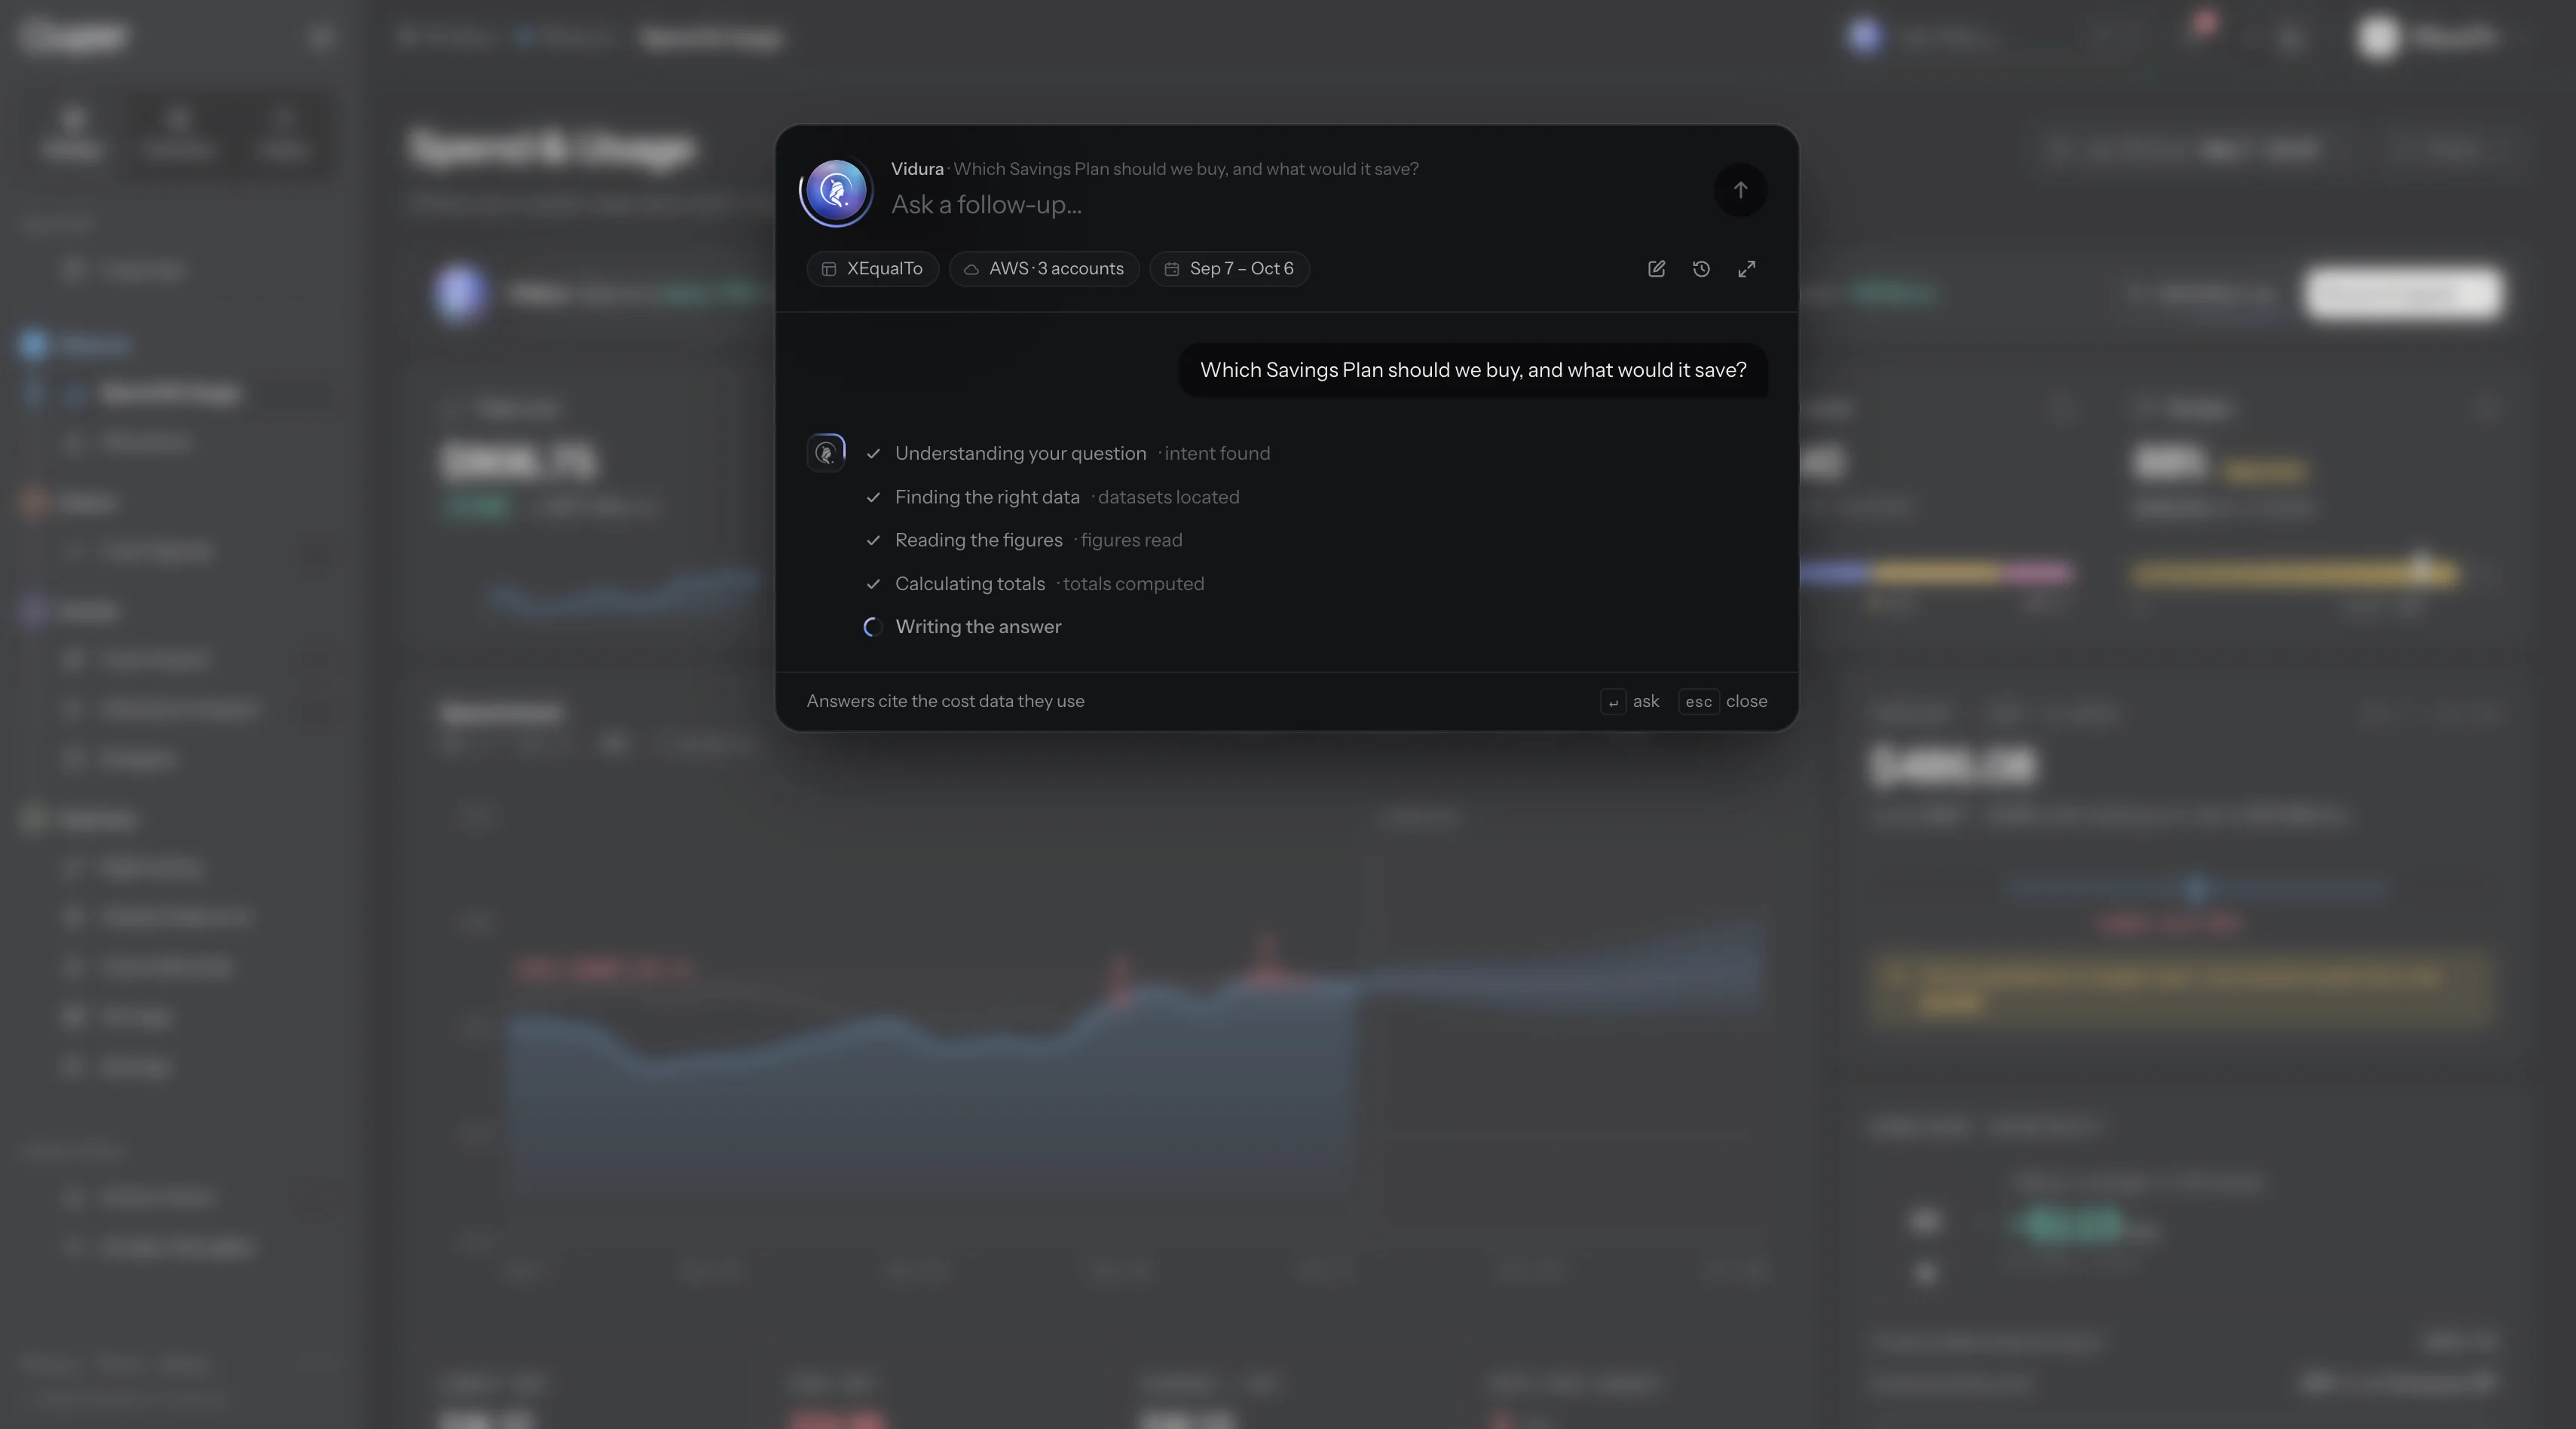
From natural language query to instant remediation
Operators can invoke Vidura via the ⌘K shortcut or the persistent top-bar action to ask complex questions like 'Where did the 32% spike in RDS spend originate this weekend?' or 'Which teams have idle Claude 3.5 Sonnet licenses?' Vidura returns verified breakdowns with one-click actions: rightsizing instances, adjusting auto-suspend timers, or routing tasks to cached prompts.
06Outcomes
- 40%
- Average cloud waste reduction
- 100%
- Visibility across AWS, Snowflake & Databricks
- Startup Foundry
- Selected accelerator program
Recognized at the Singapore Tech Conference and selected into Startup Foundry, validating Quper's unified four-phase operating model.
Strategy & Architecture
- Brand positioning
- Unified 4-phase loop (Observe -> Detect -> Decide -> Optimise)
- Multi-tenant workspace model
Web Experience
- Complete marketing website
- Interactive cost models
- Performance-tuned front end
Product UI / UX
- 500+ screens across design iterations
- FinOps, DataOps & AIOps suites
- Vidura AI grounded assistant
- Light and dark themes
Front-End Engineering
- Production Next.js, React & Tailwind
- Auditable /data layer & validation script
- Microinteractions & sound effects