01The challenge
Customer data is only useful when someone can read it at a glance.
Bring costs, engagement and satisfaction into one view
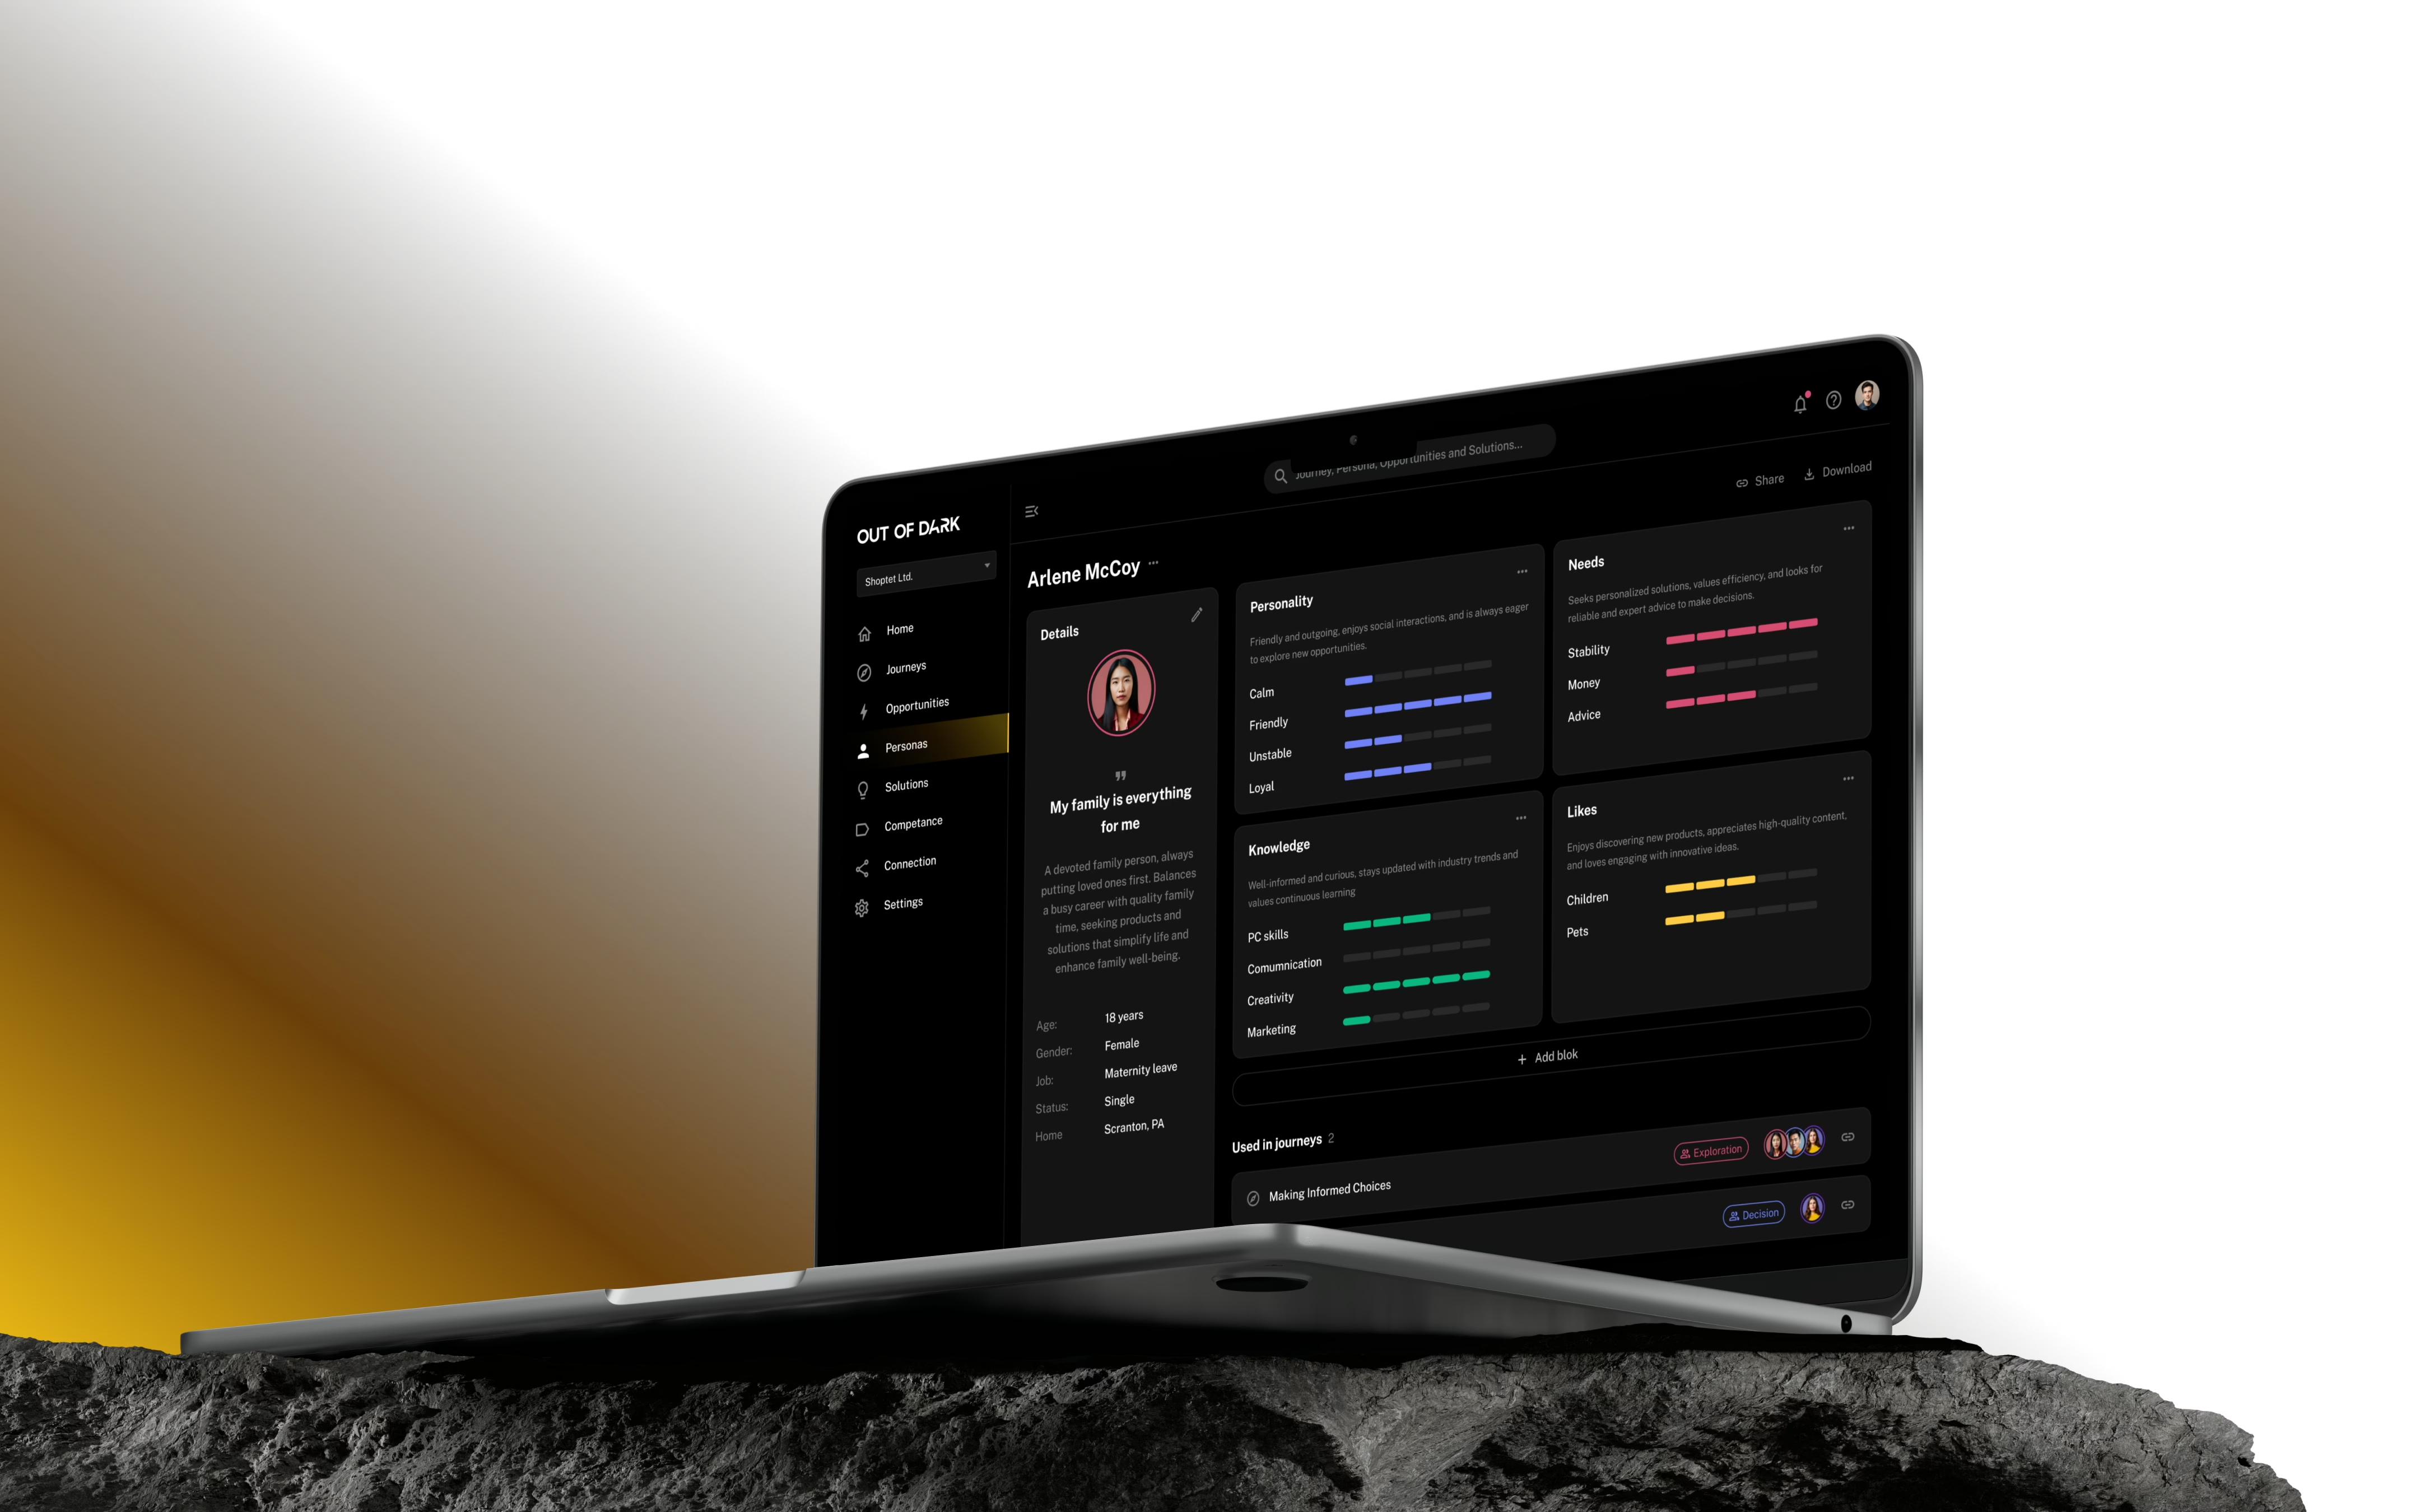
Out of Dark helps businesses understand their customer journeys. The data that matters, budgets, visits, calls and satisfaction, usually sits in different tools and different reports, so teams can't easily see where an experience is working or failing.
We created the brand and the product design together, putting costs, engagement and satisfaction into one shared view across each stage of the journey. Developing them side by side meant the interface felt like a single, coherent experience as it took shape.
02Strategy
Light in the dark
Analytics tools tend to either shout with colour or disappear into grey. Our idea was to treat light as the brand: a quiet, amber glow that points to what needs attention, so the data stays calm and the signal stands out.
- 100+
- Screens designed
- 2
- Responsive views: desktop and mobile
- 1
- Shared component system
Metrics published by Dataleap as of 2025 across production software deployments.
03Brand
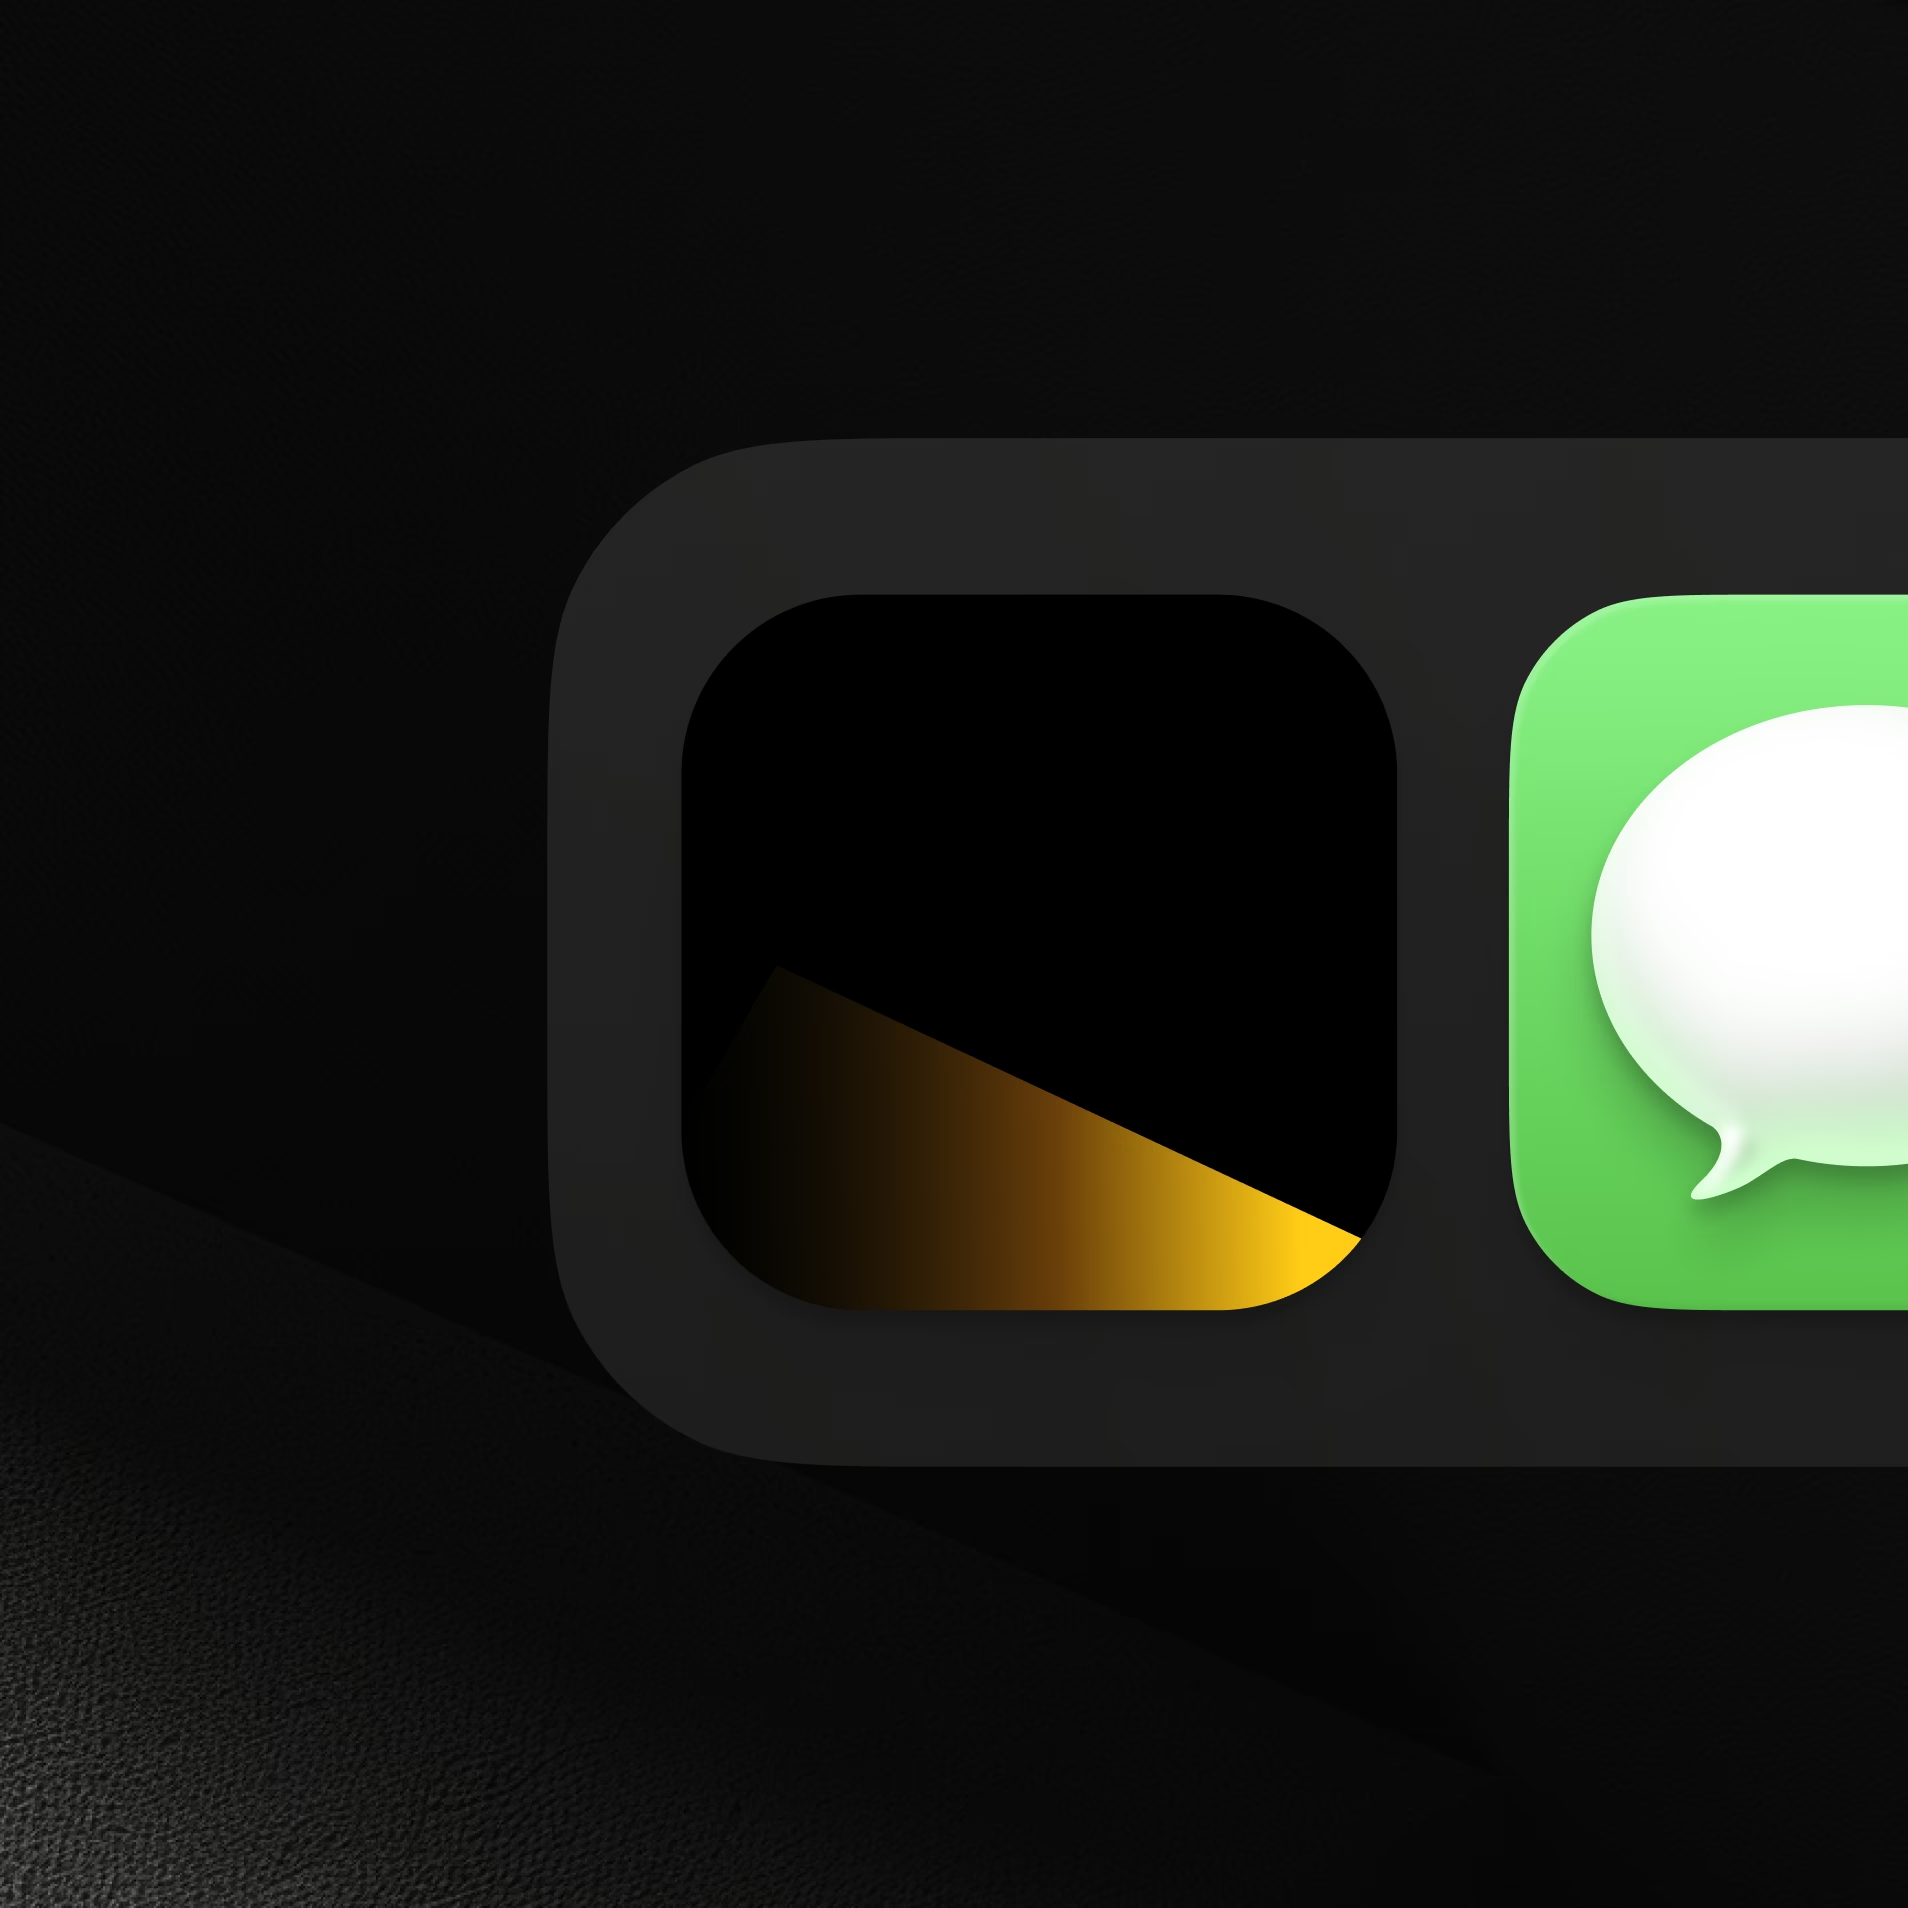
Light as a visual theme
The identity uses light as its theme: an amber glow moving across near-black surfaces. We carried it into the interface while keeping reports and customer data easy to scan. A distinctive look matters in a crowded category, but only if it never gets in the way of the work users came to do.

04Journeys
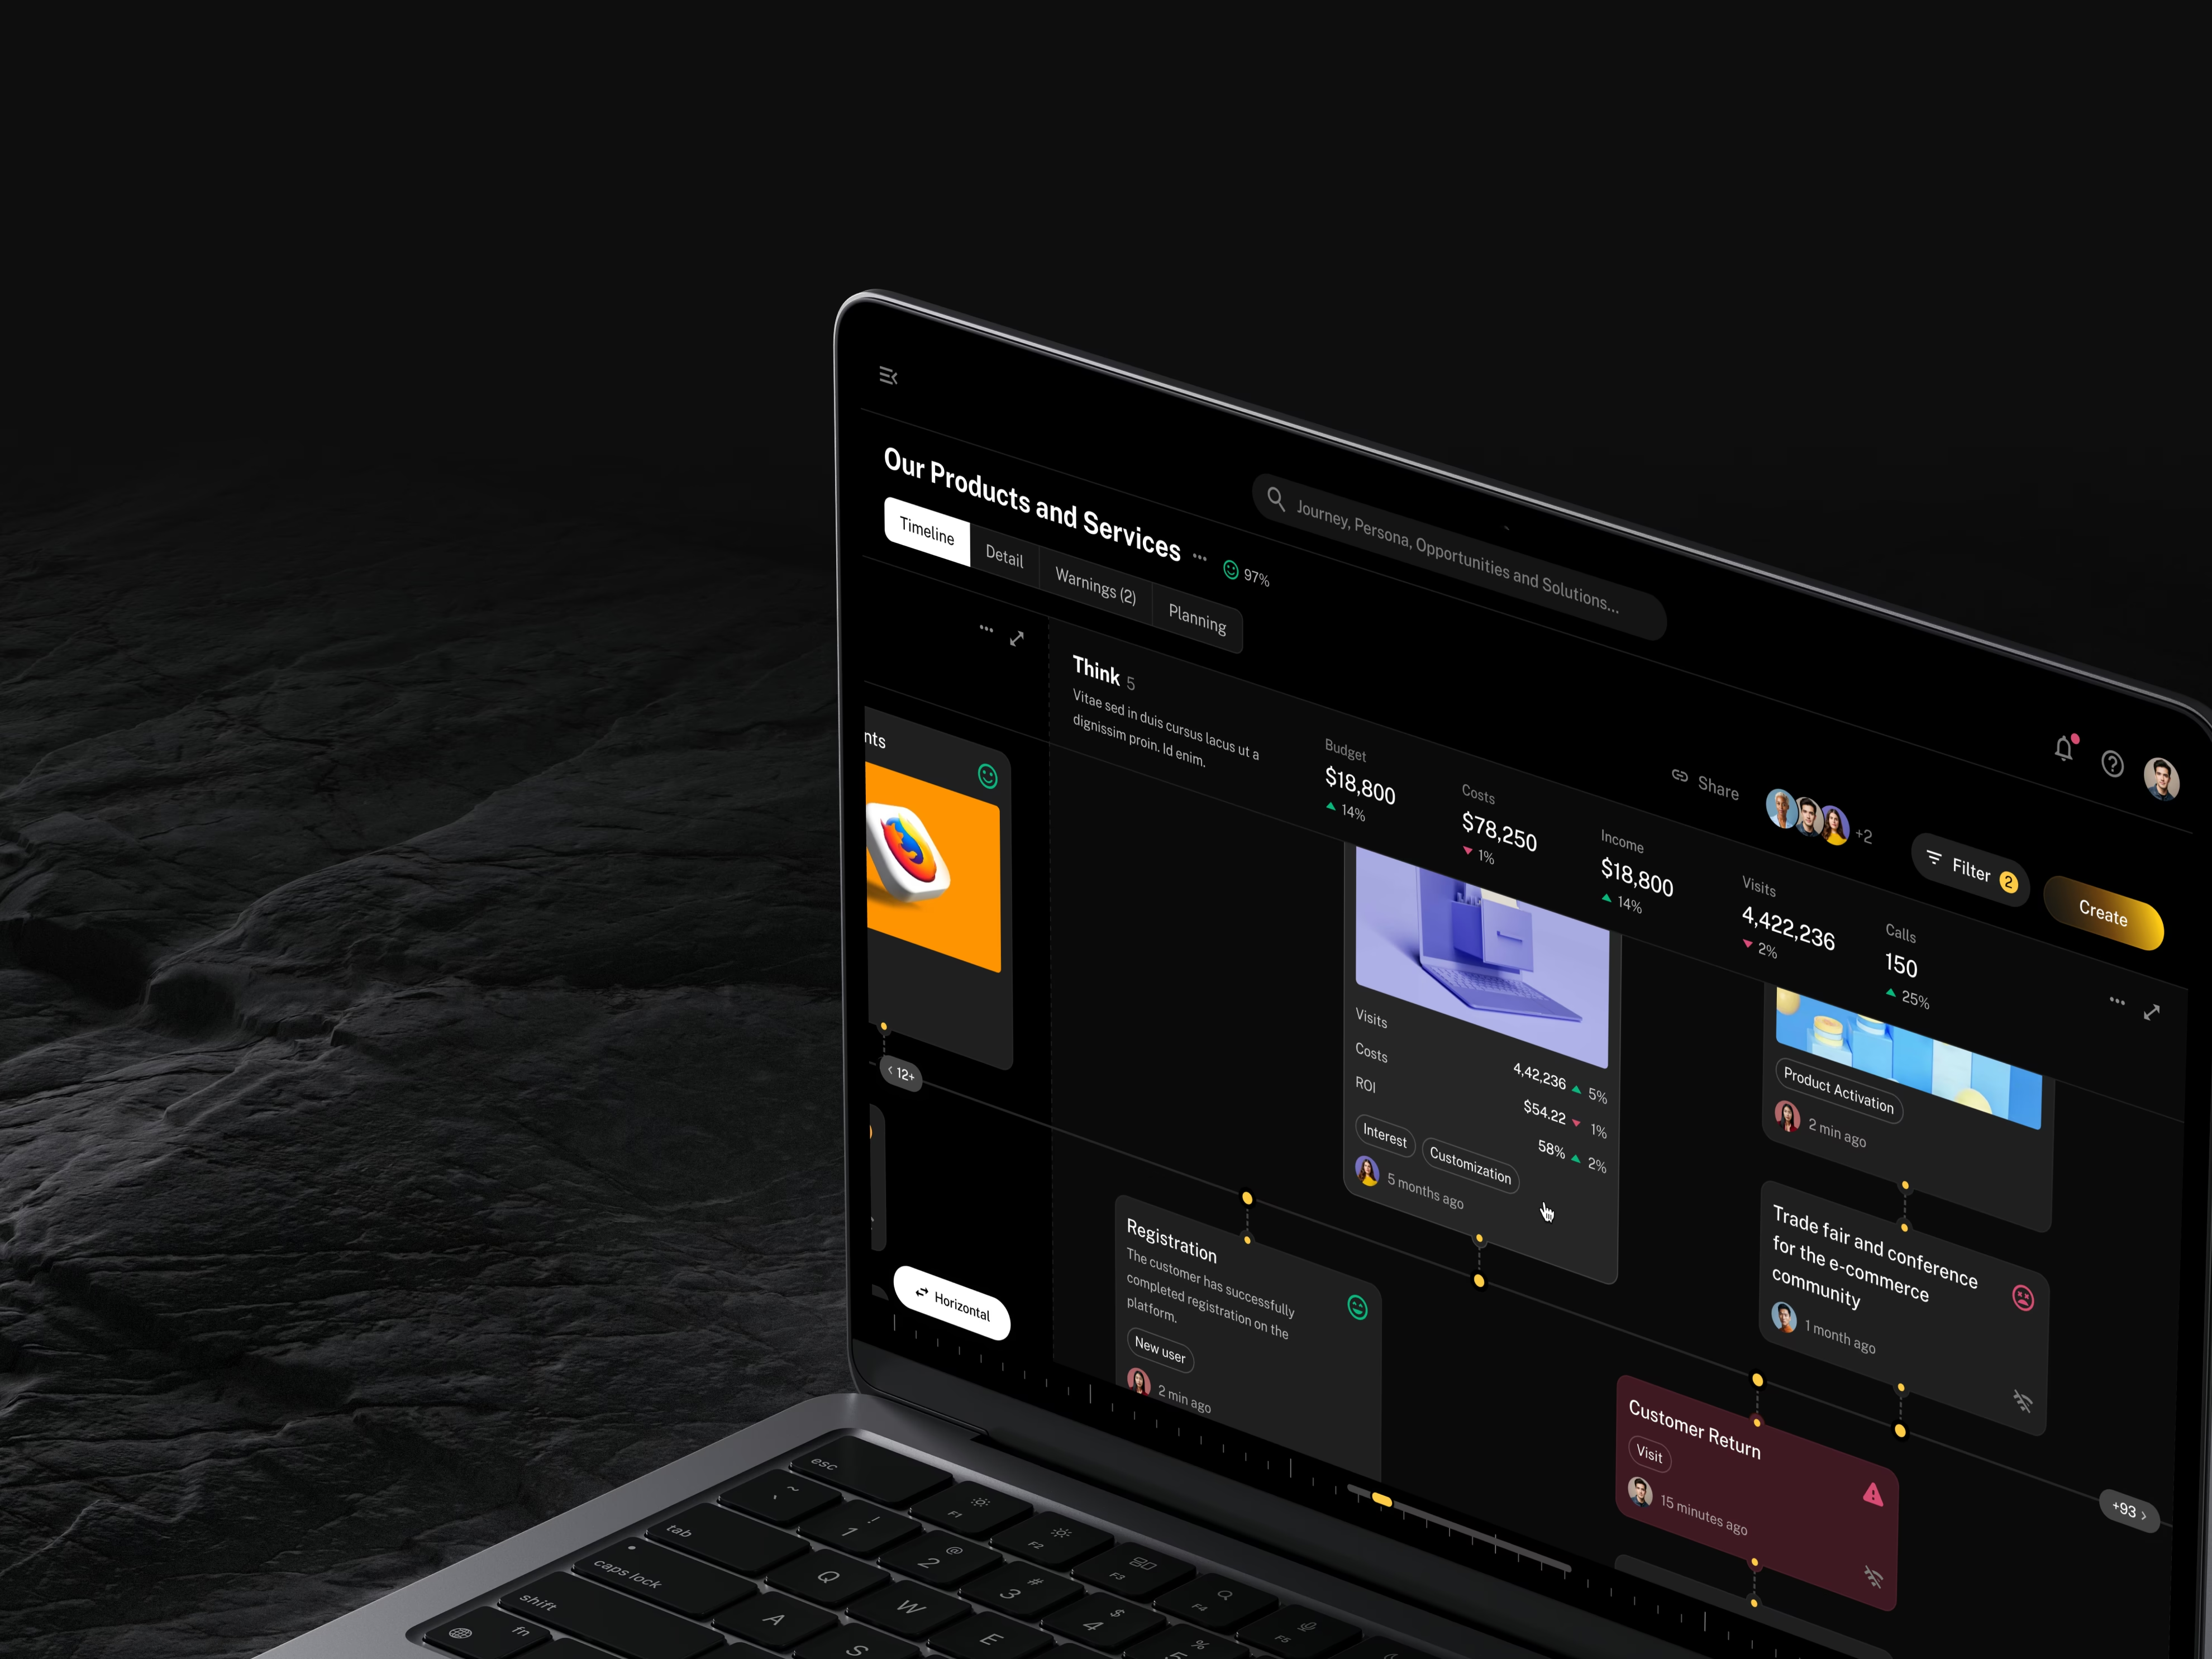
Made complex customer reports easier to scan
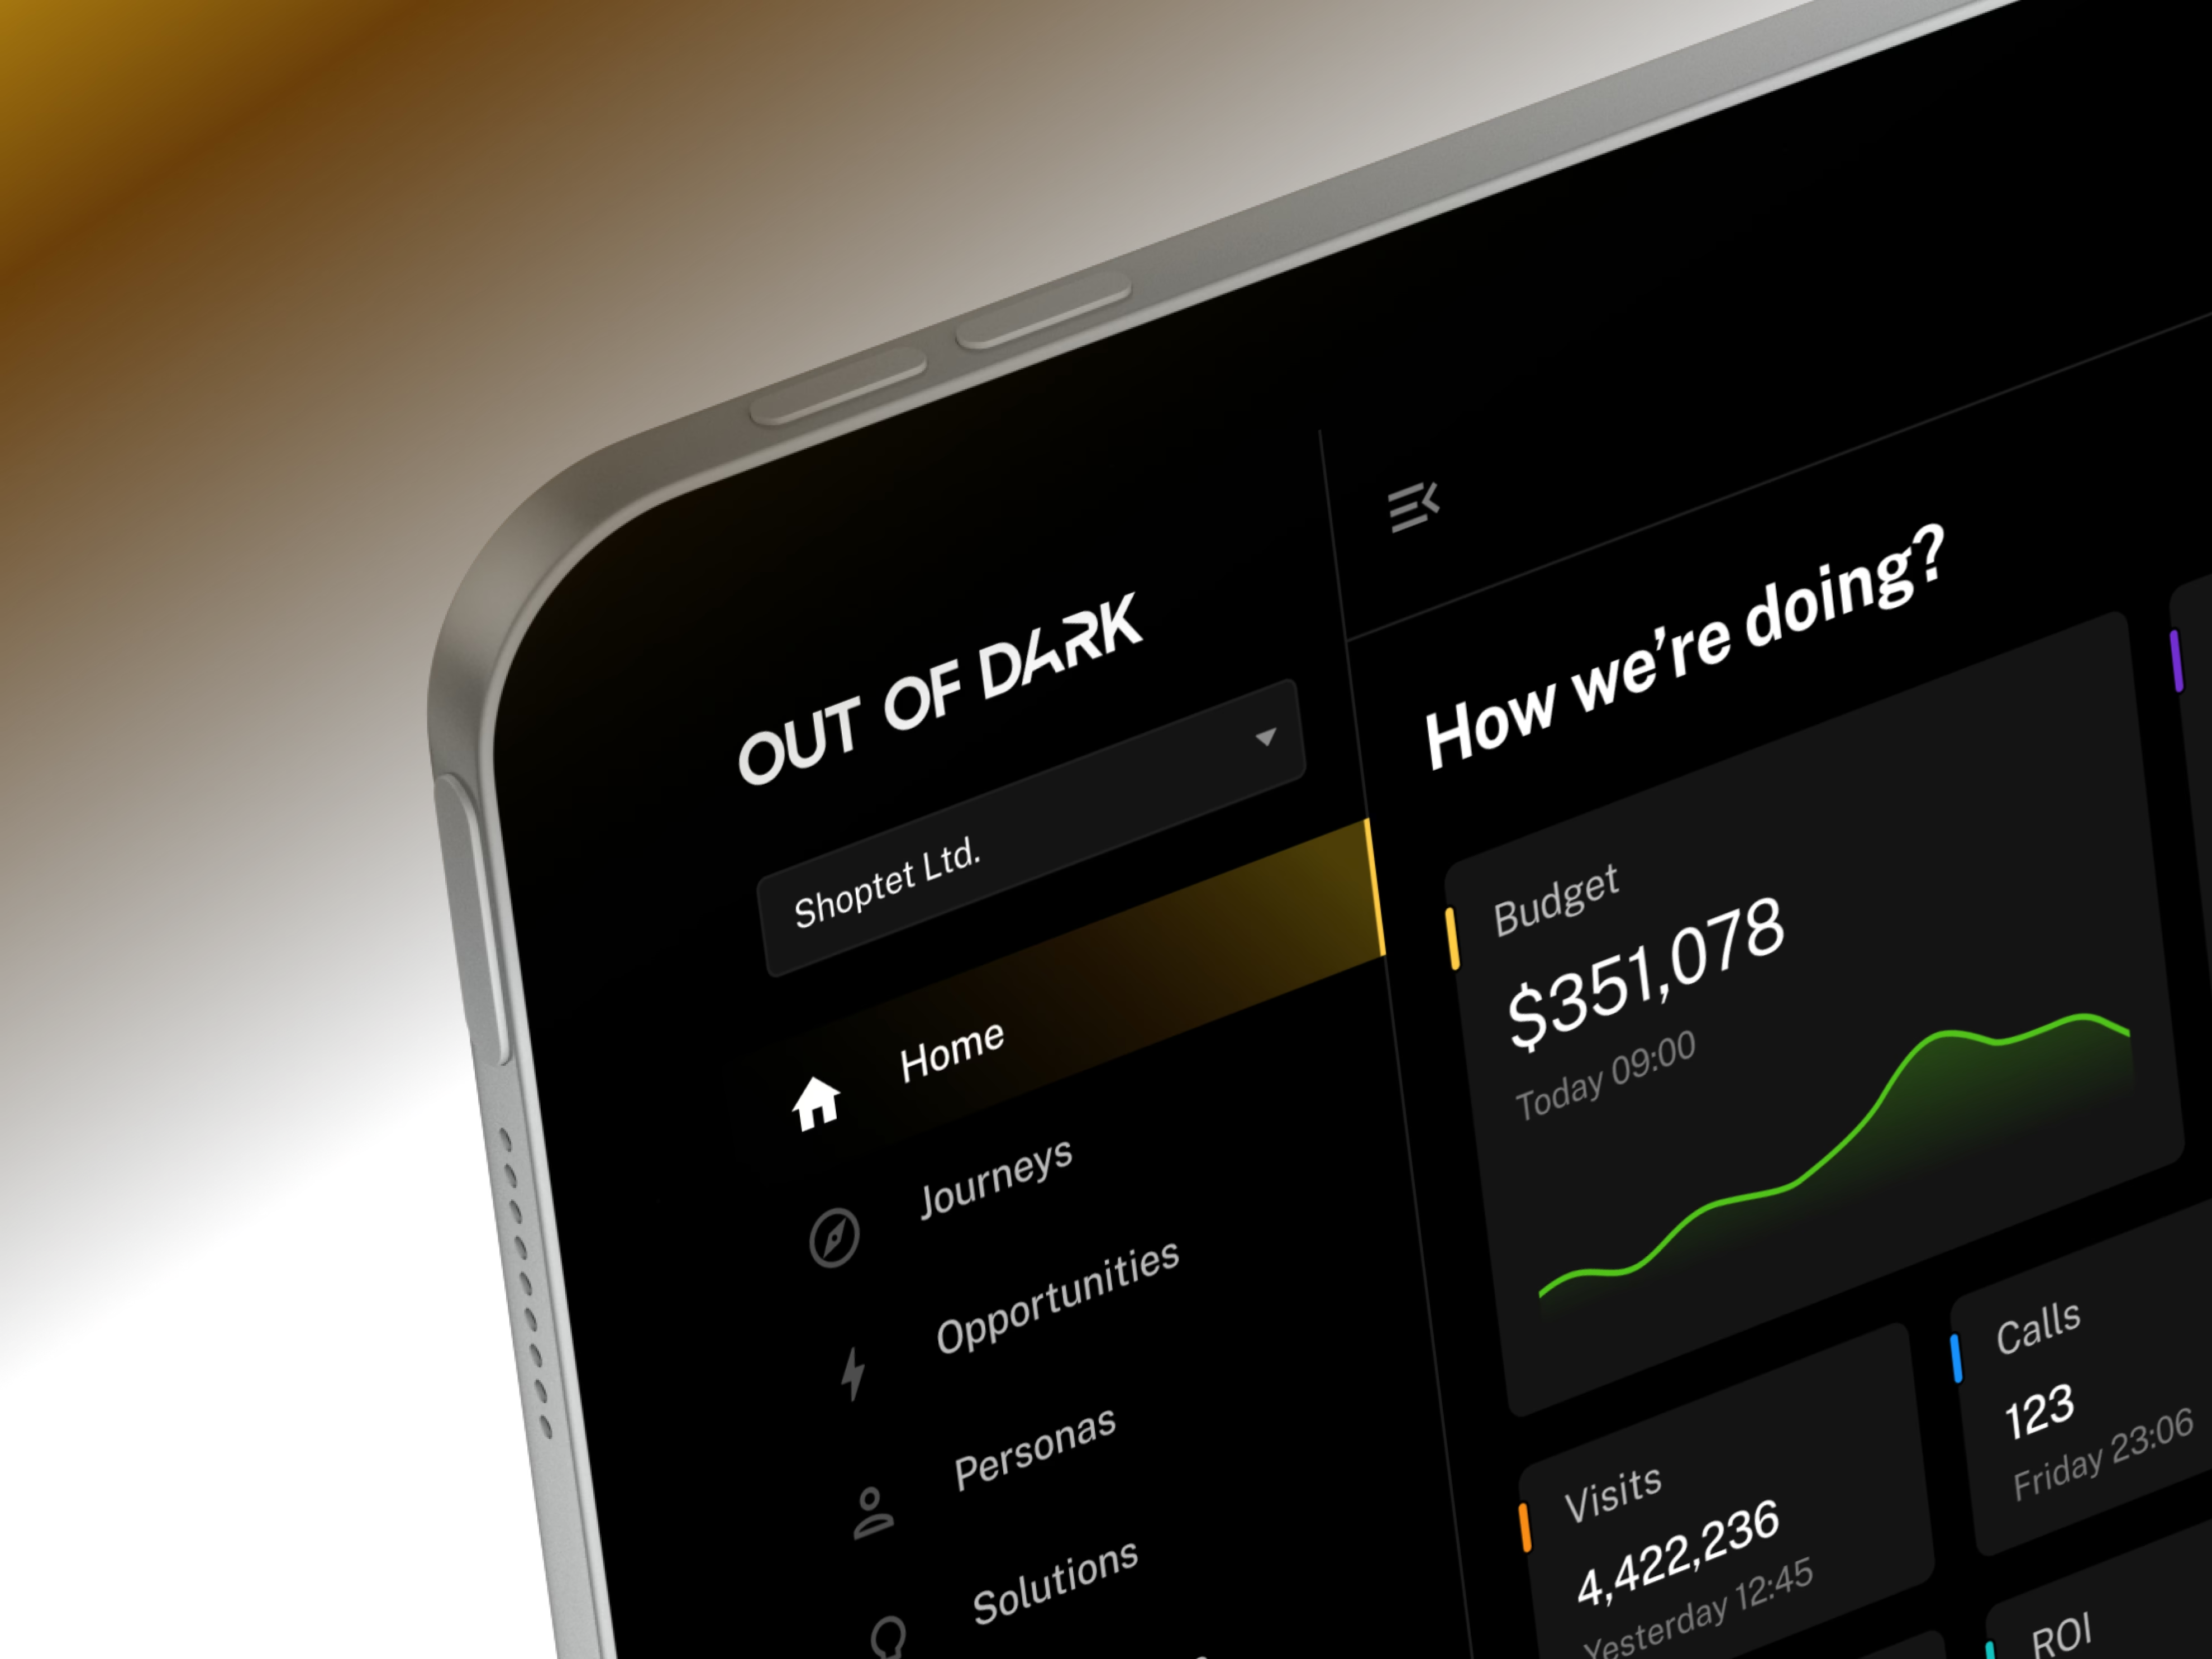
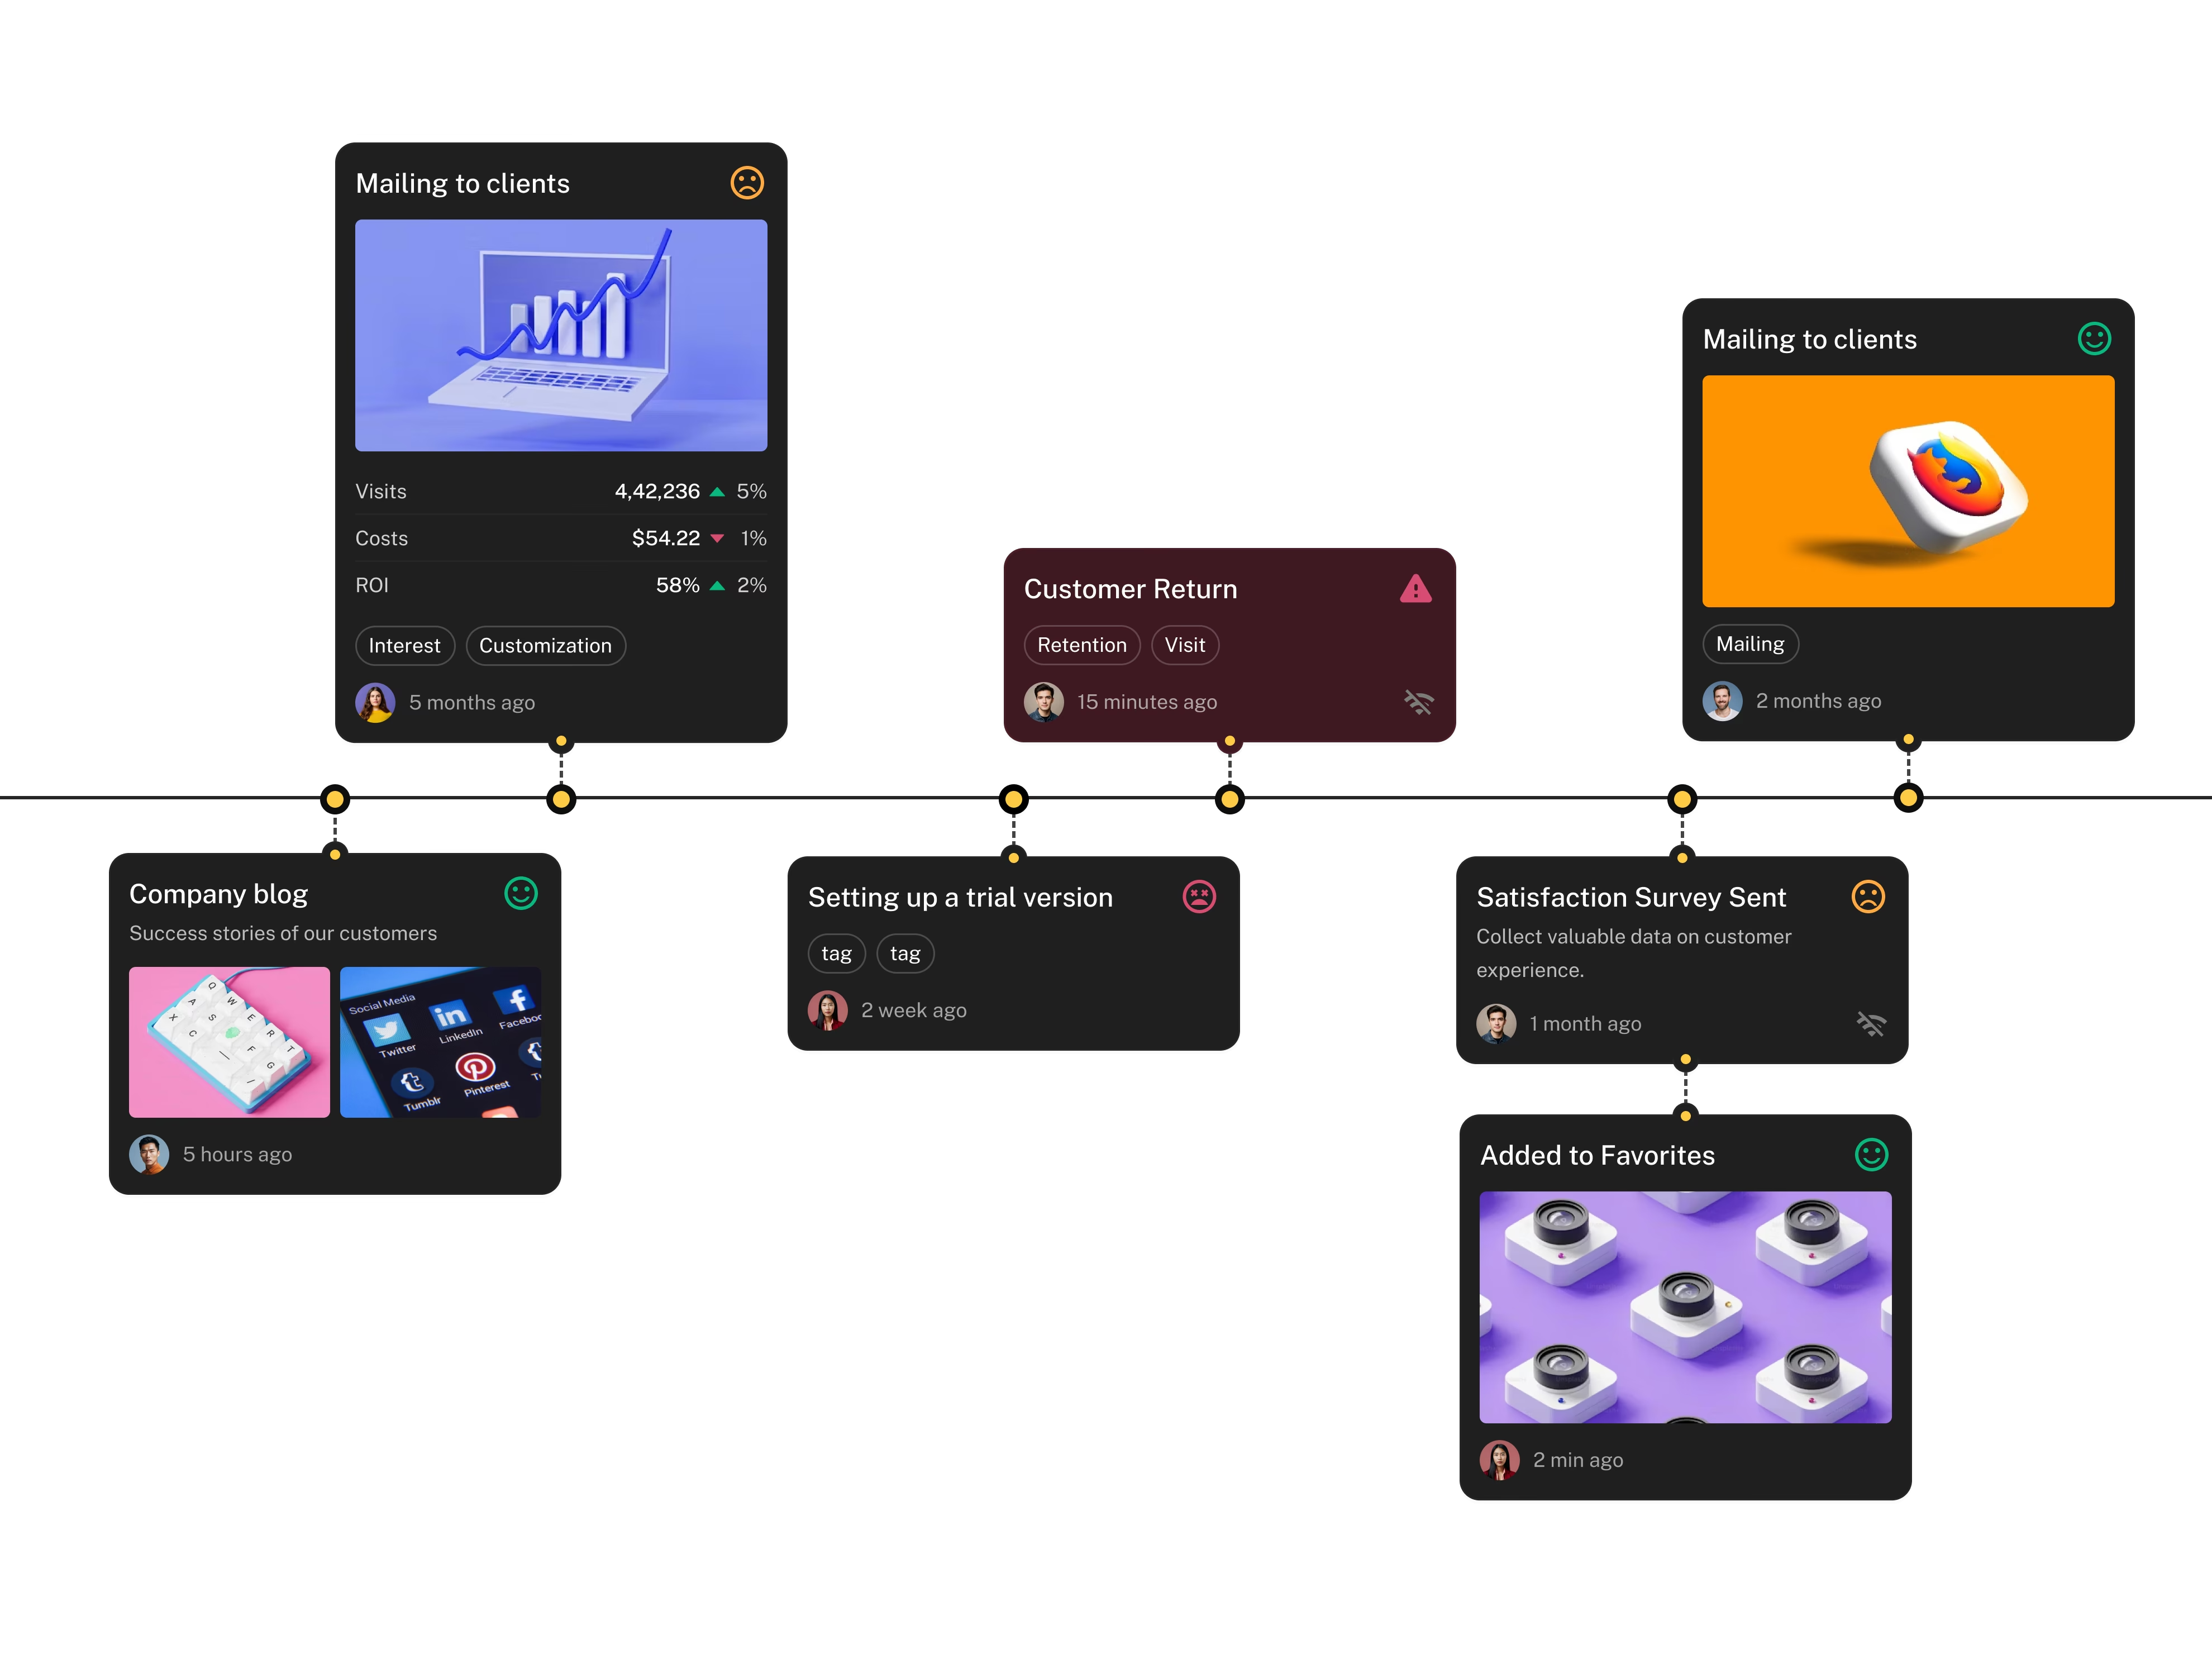
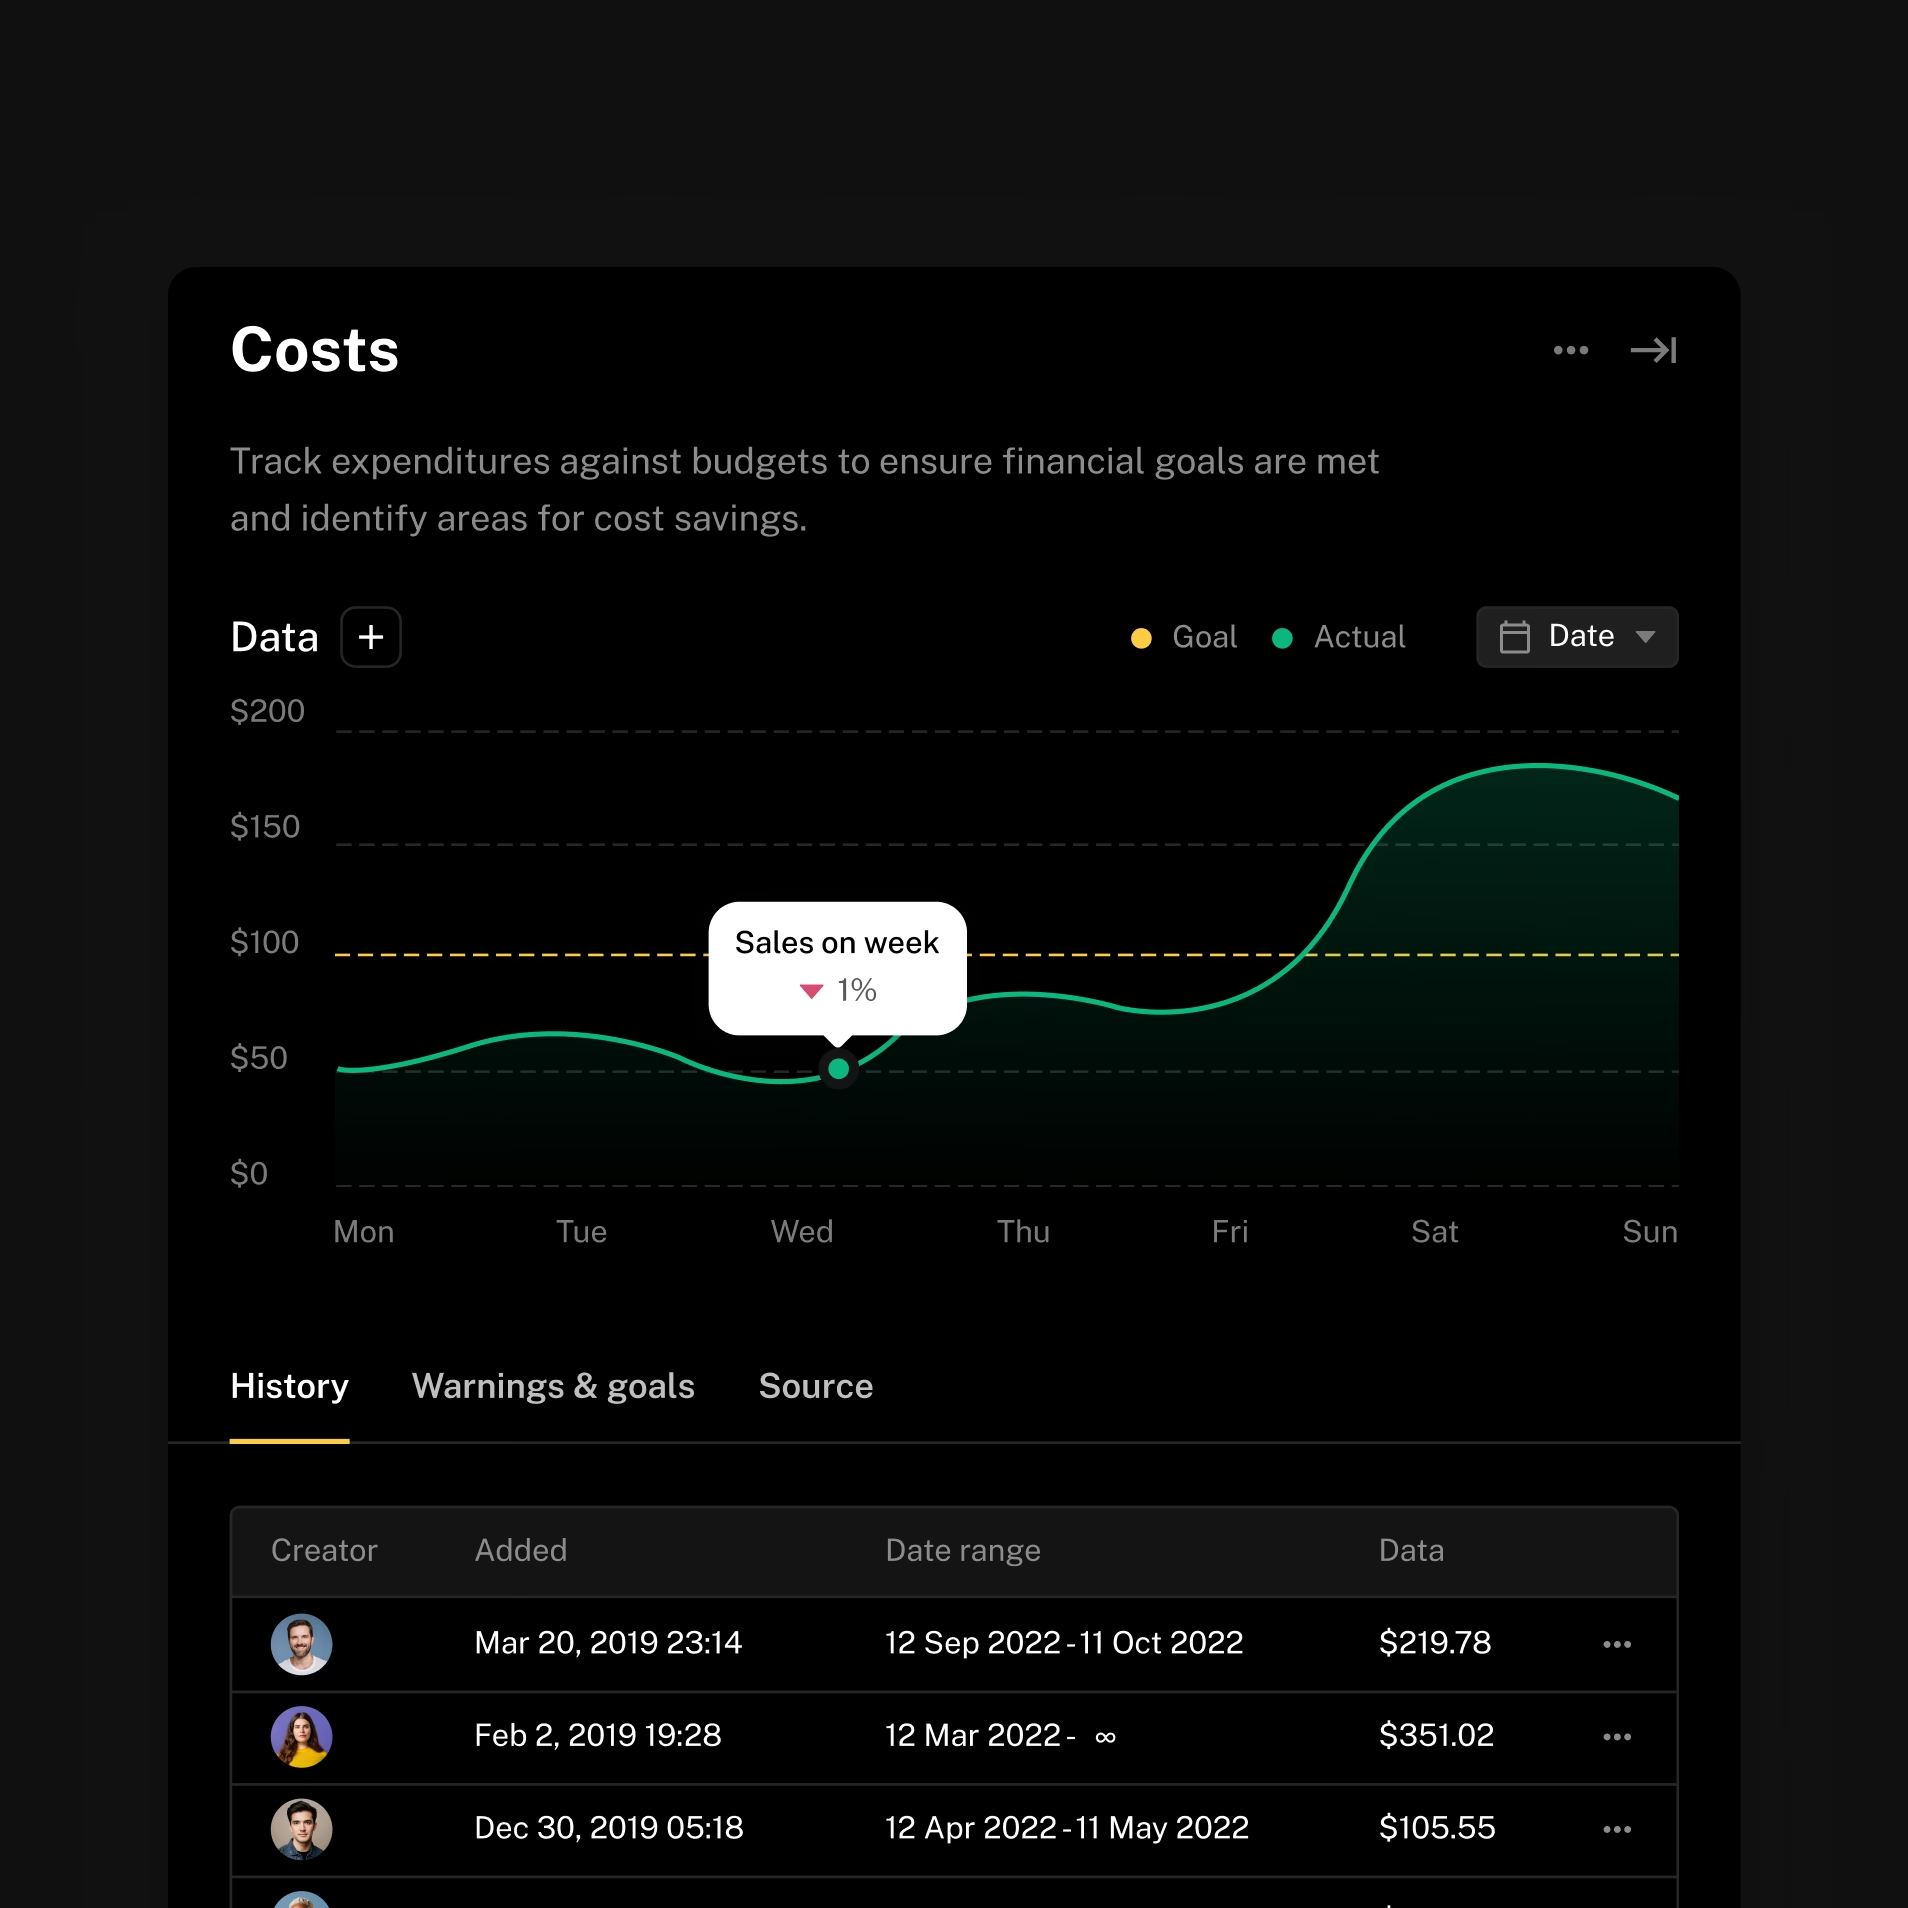
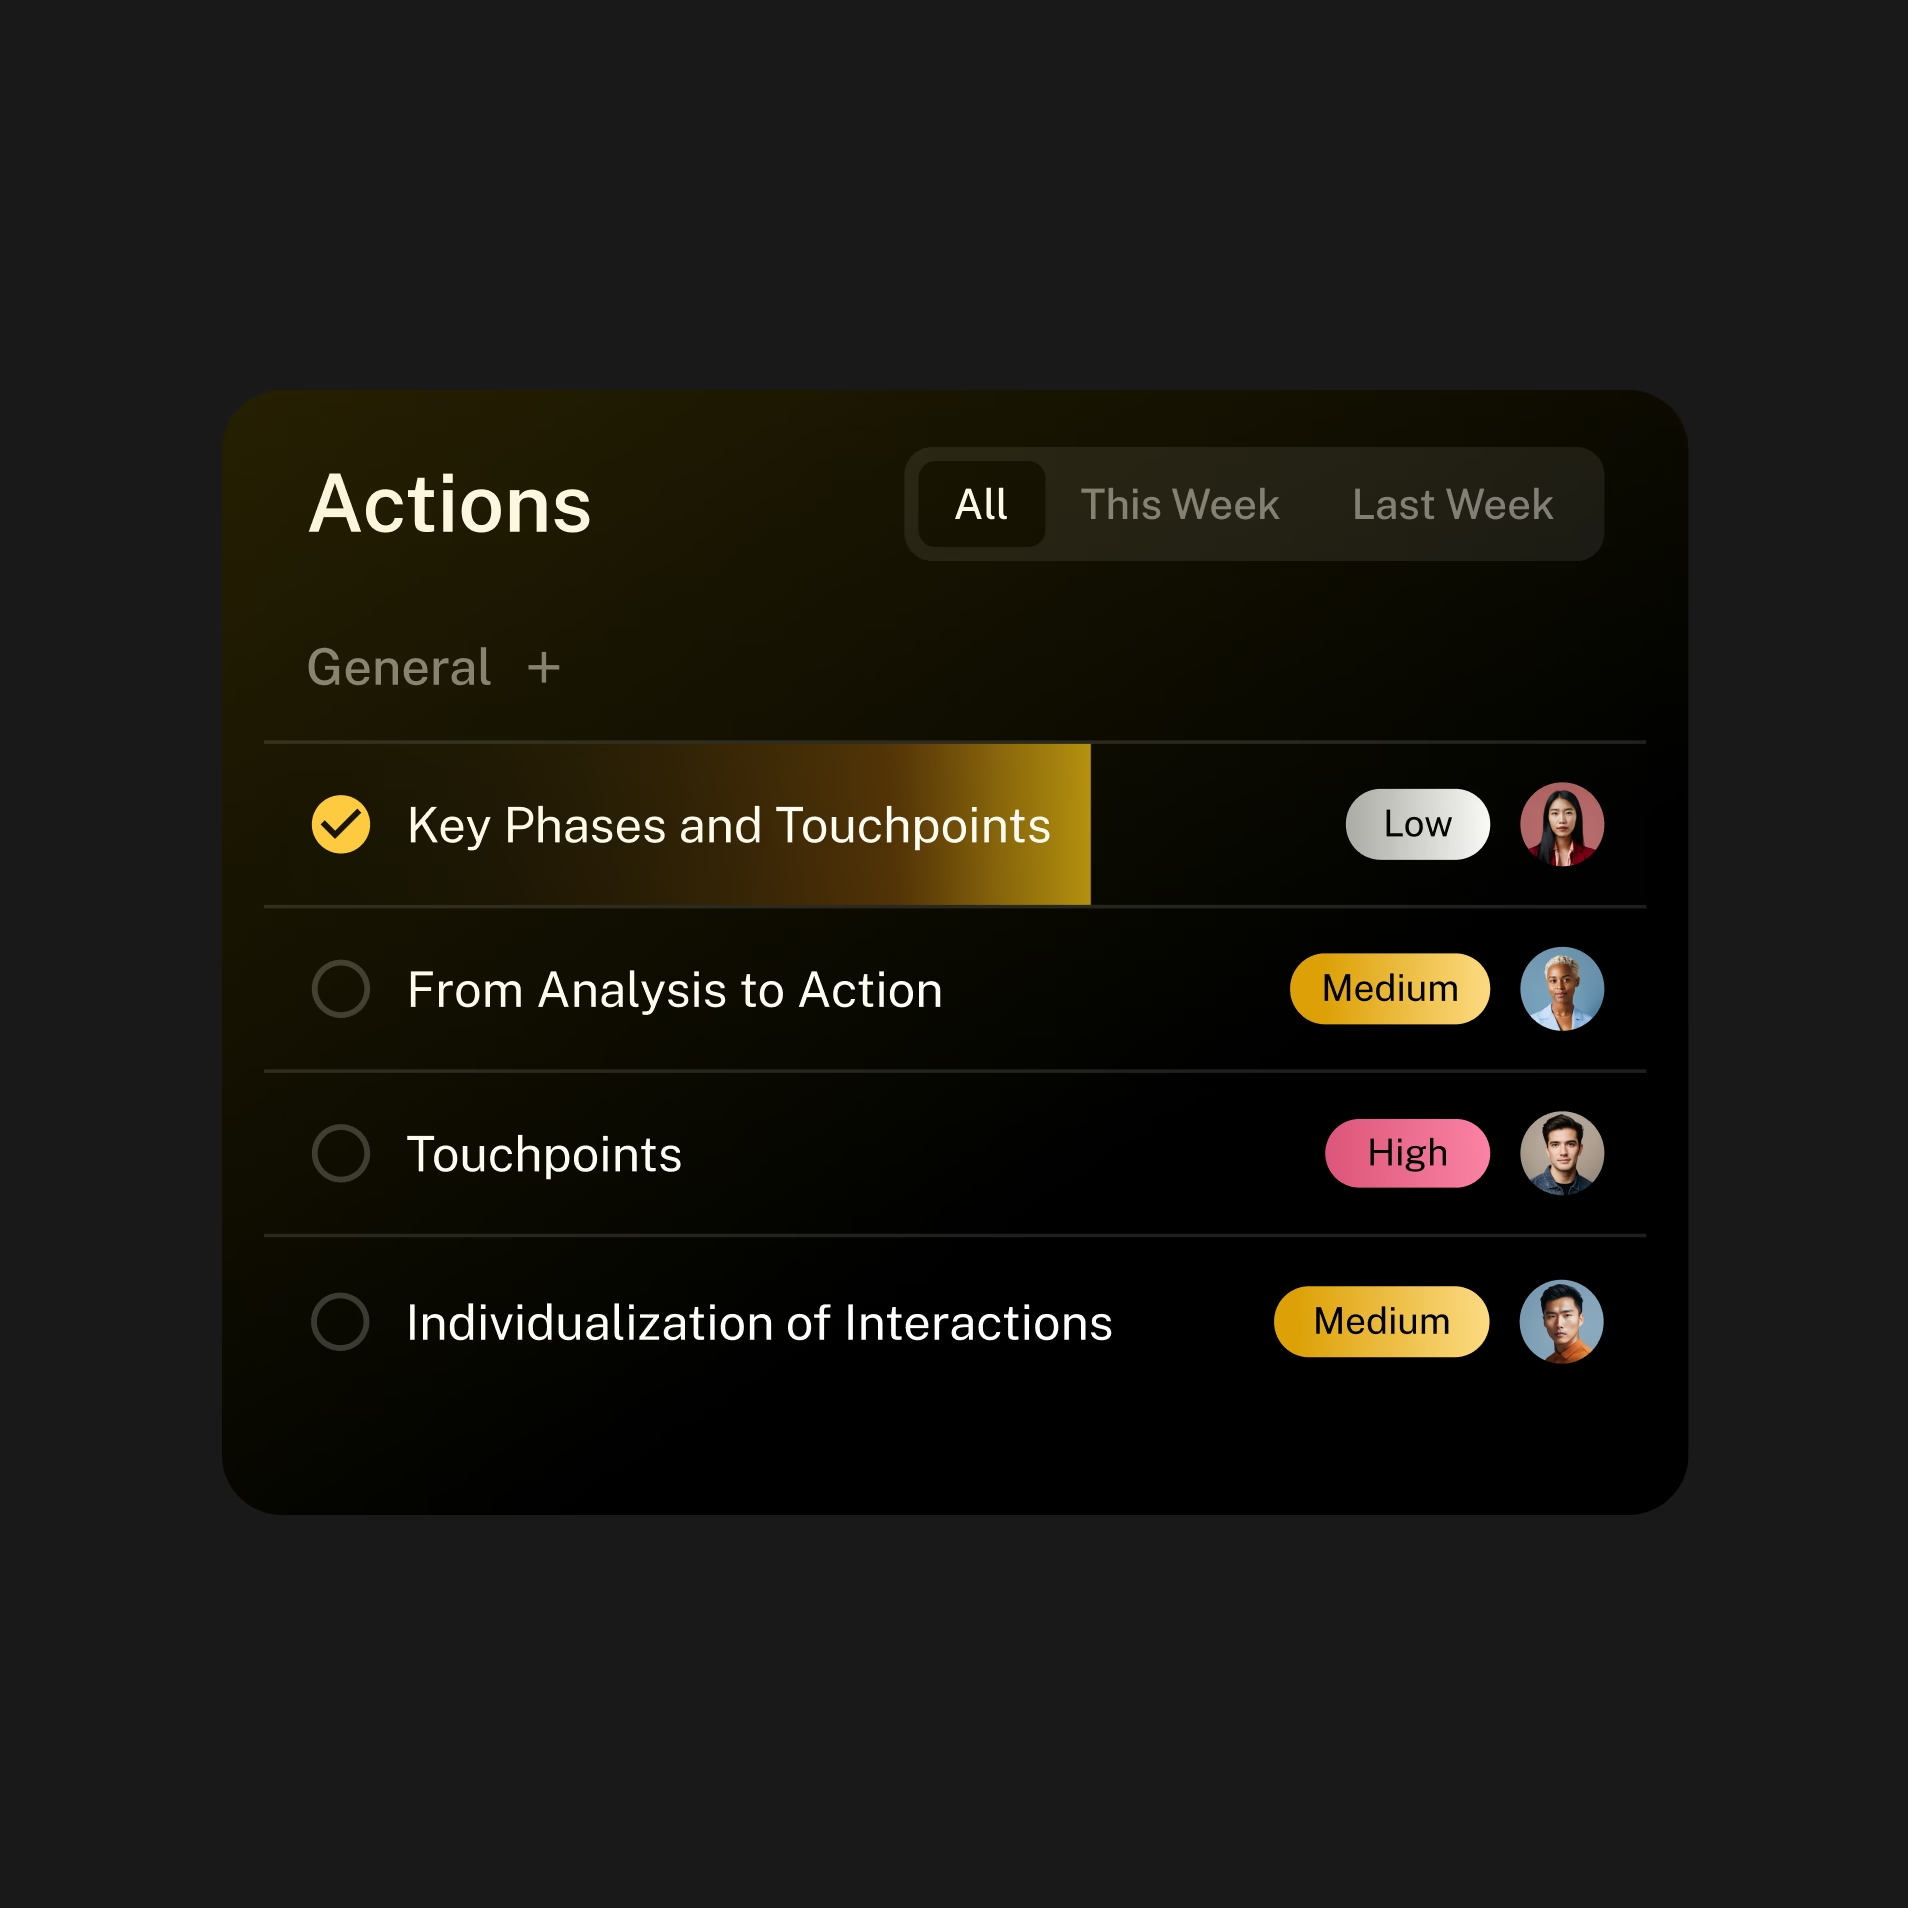
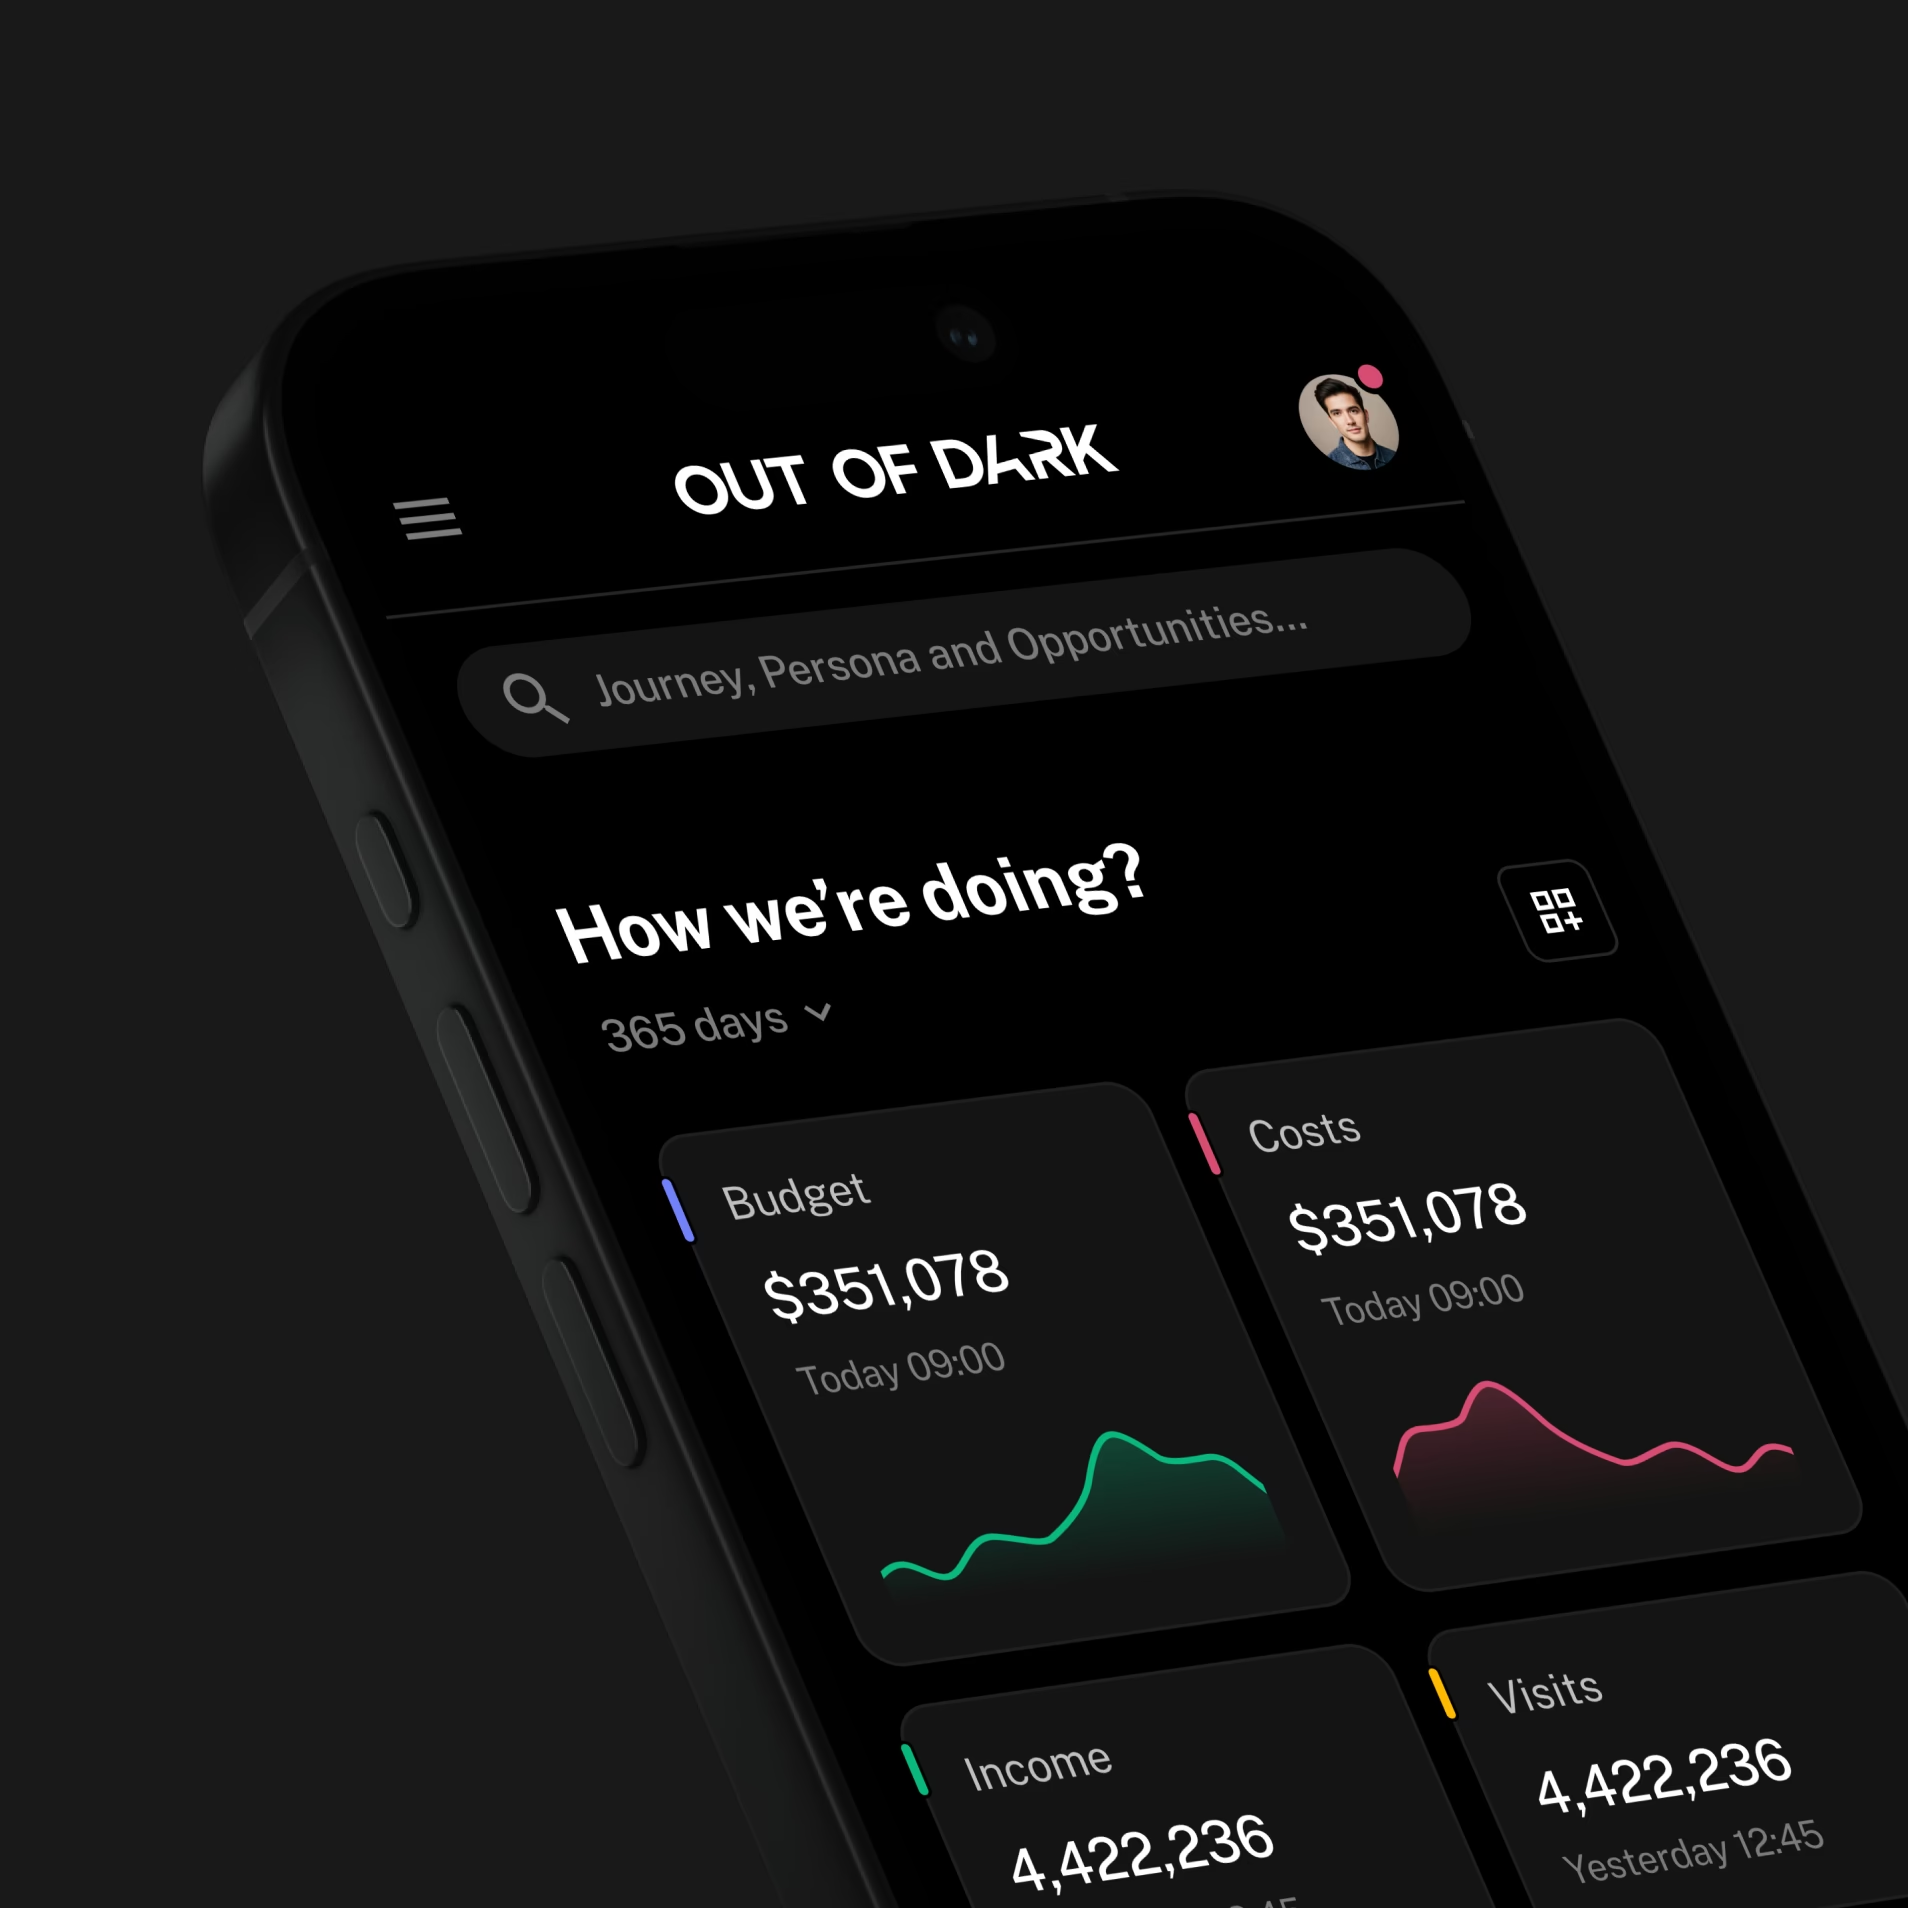
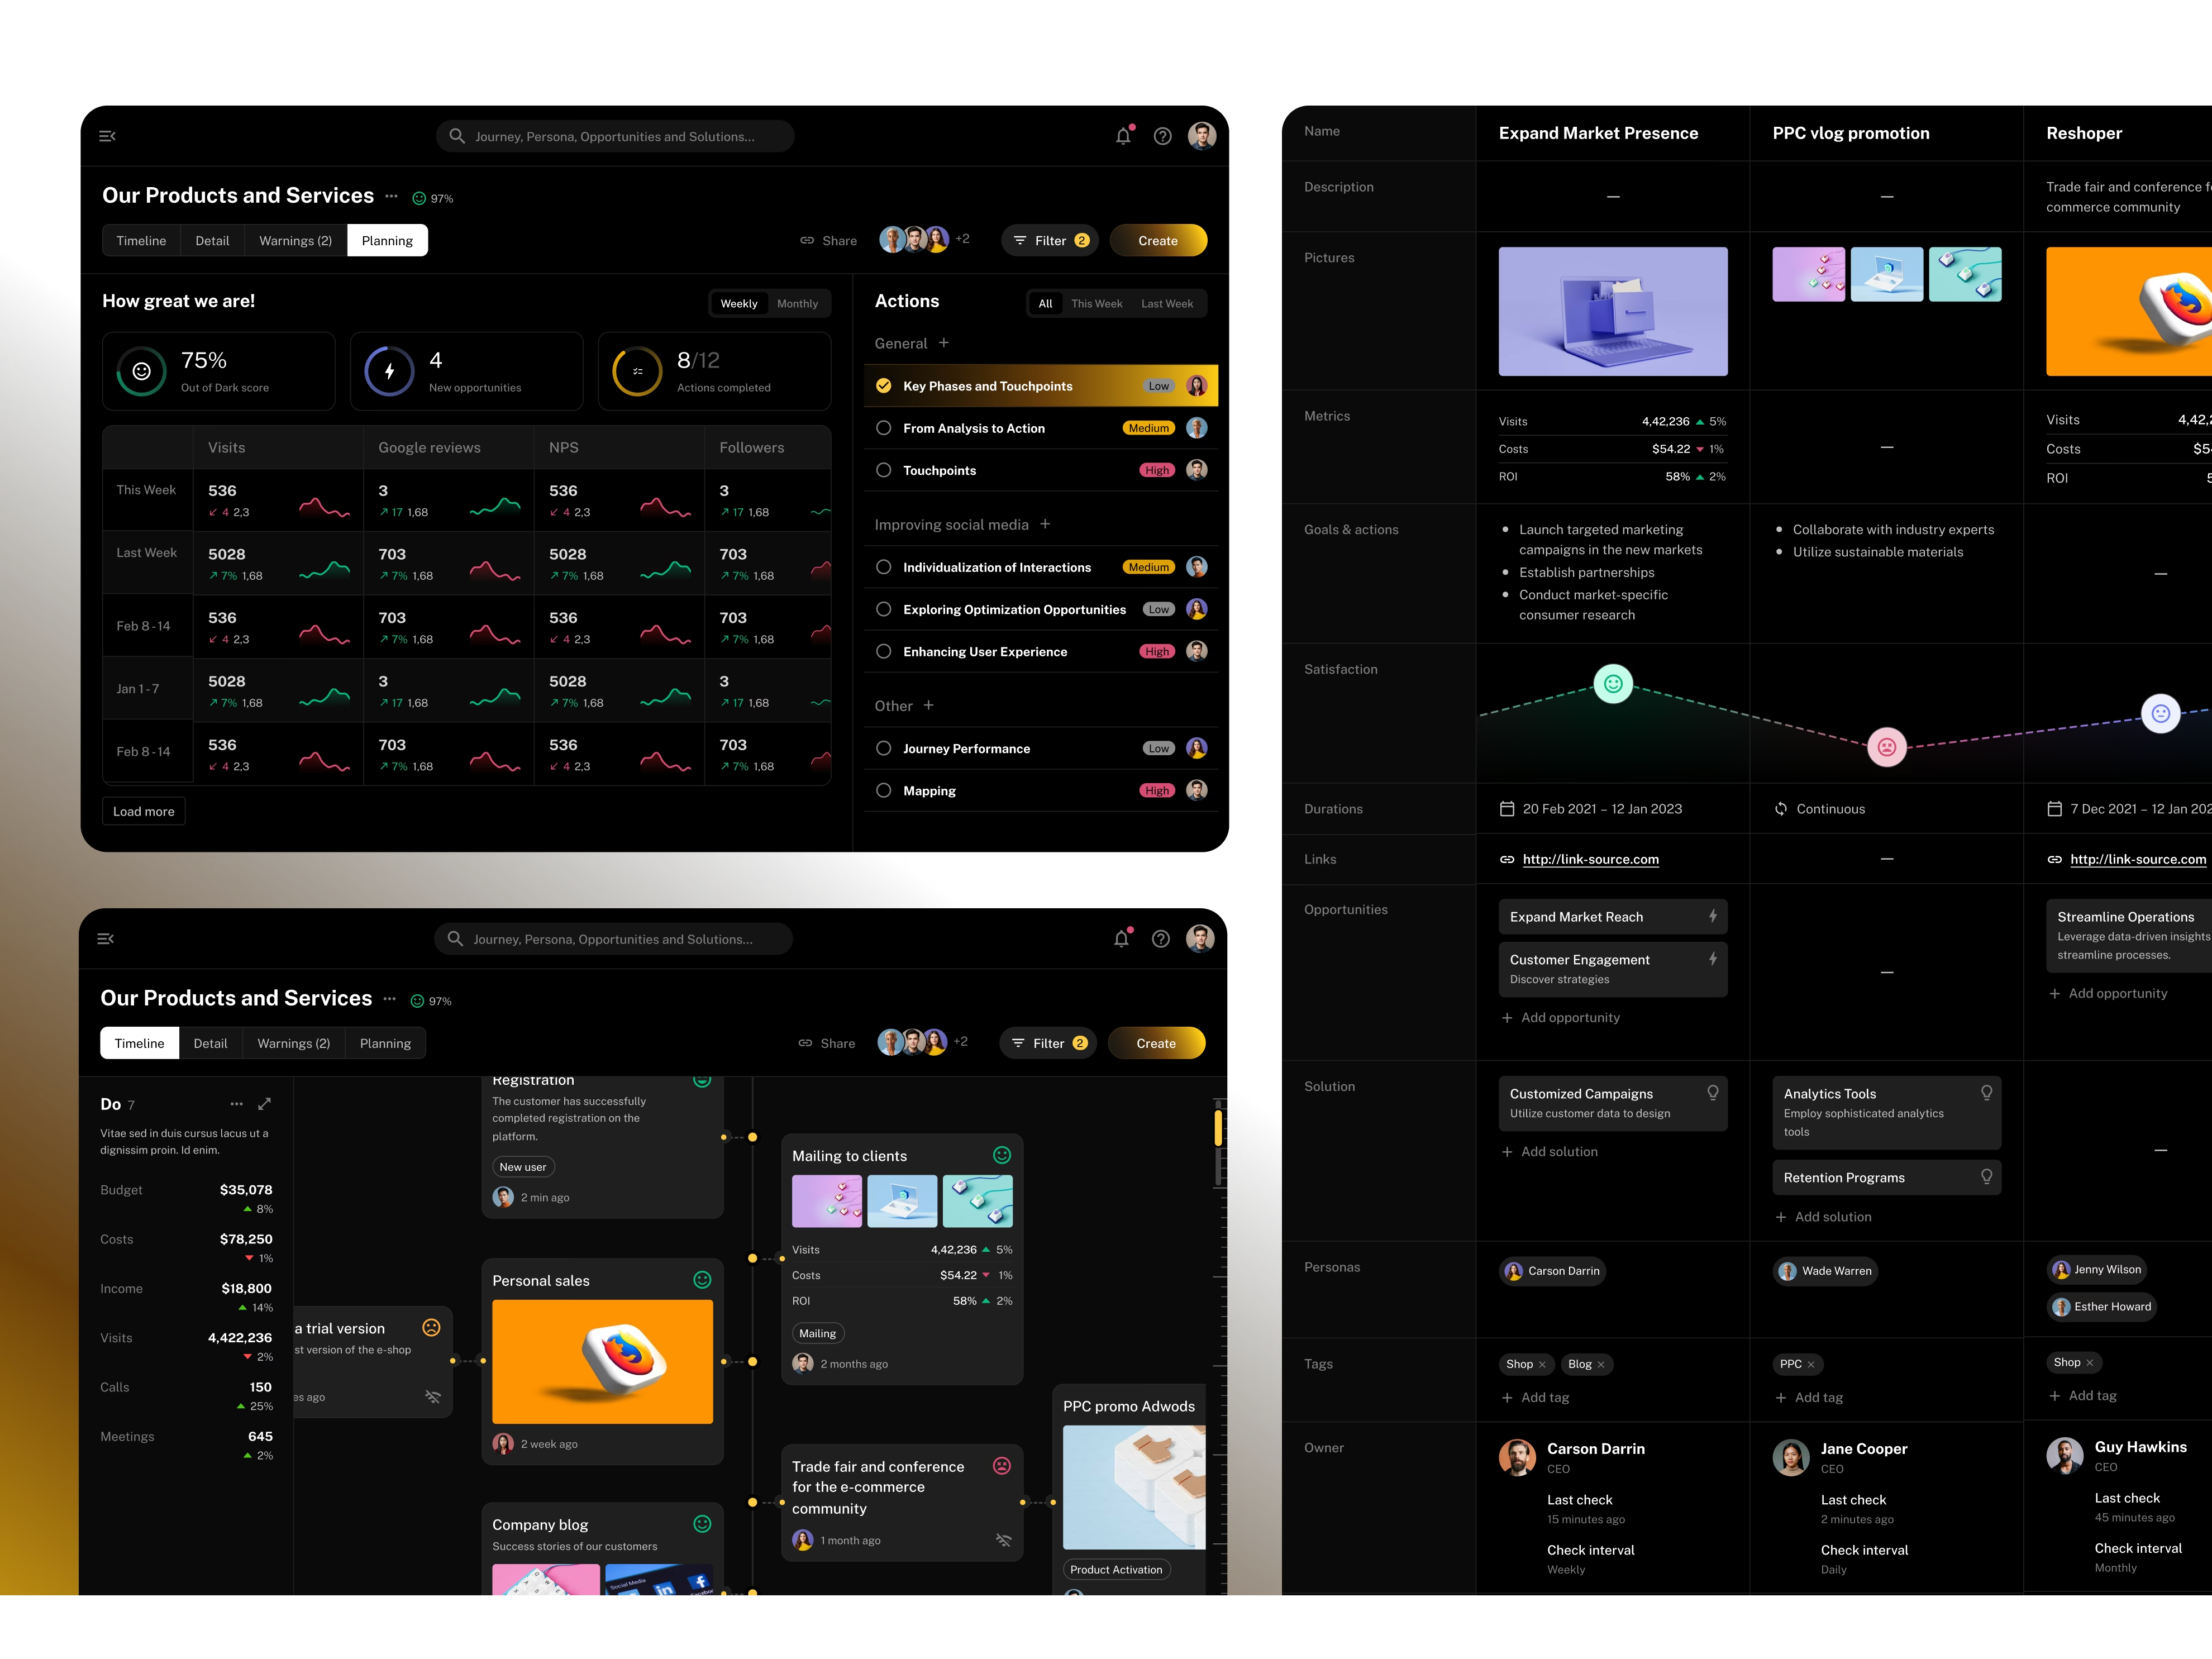
Budgets, visits, calls and satisfaction sit in the same journey, so users can compare what matters without switching views. Card layouts, visual hierarchy and colour-coded indicators separate the signals in a dense interface, and users can move from the wider journey to the data behind a specific point in the experience.
05Handoff
A foundation the client's developers can build on
A consistent design system gives the client's developers a clear foundation. We adapted a component library to the design, so the team can implement and extend the product without redrawing it each time, and a product with 100+ screens stays consistent as it grows.
- 01
Understand the journey
Map the stages and the signals that matter at each one.
- 02
Design the views
Desktop and mobile layouts for the data users need to compare.
- 03
Prepare for development
Reusable components and a handoff the client's team can build on.
06Deliverables
Brand
- Identity
- Light as a visual theme
Product
- 100+ screens
- Desktop and mobile views
- Journey, cost and satisfaction views
System
- Adapted component library
- Developer handoff